The essentials
The Labour Bureau publishes a monthly figure for what a day's work pays in rural India, and it is the Government's main measure of rural wages. In July 2025 the series jumped, and for a year the Bureau reported growth of 16.07 per cent to 19.55 per cent a year, against 6.56 per cent in June 2025. This brief sets out why that happened and what the true picture is.
FindingWhat the Bureau's own figures showA jump of 12.66 per cent in one month
The Bureau's average daily wage for rural men was Rs 453.51 in June 2025, and Rs 510.91 in July 2025. Since the 25-occupation series began in November 2013, no other month has carried a rise larger than 2.27 per cent.
Source: Labour Bureau, rural wage table, July 2013 to August 2026, queried 20 October 2026 ; Labour Bureau, Detailed Note on the CPI-AL and CPI-RL base revision, 18 July 2025 ; MoSPI, PLFS 2025 unit-level data, catalogue 284, 2026 ; Labour Bureau, CPI-AL and CPI-RL press release for August 2026, 18 September 2026 .
New villages, not new pay
In July 2025 the Bureau began collecting wages in 787 new sample villages, which replaced 600 old ones. It then compared the new villages with the old ones, without ever linking the two series.
Source: Labour Bureau, rural wage table, July 2013 to August 2026, queried 20 October 2026 ; Labour Bureau, Detailed Note on the CPI-AL and CPI-RL base revision, 18 July 2025 ; MoSPI, PLFS 2025 unit-level data, catalogue 284, 2026 ; Labour Bureau, CPI-AL and CPI-RL press release for August 2026, 18 September 2026 .
Small territories given a large say
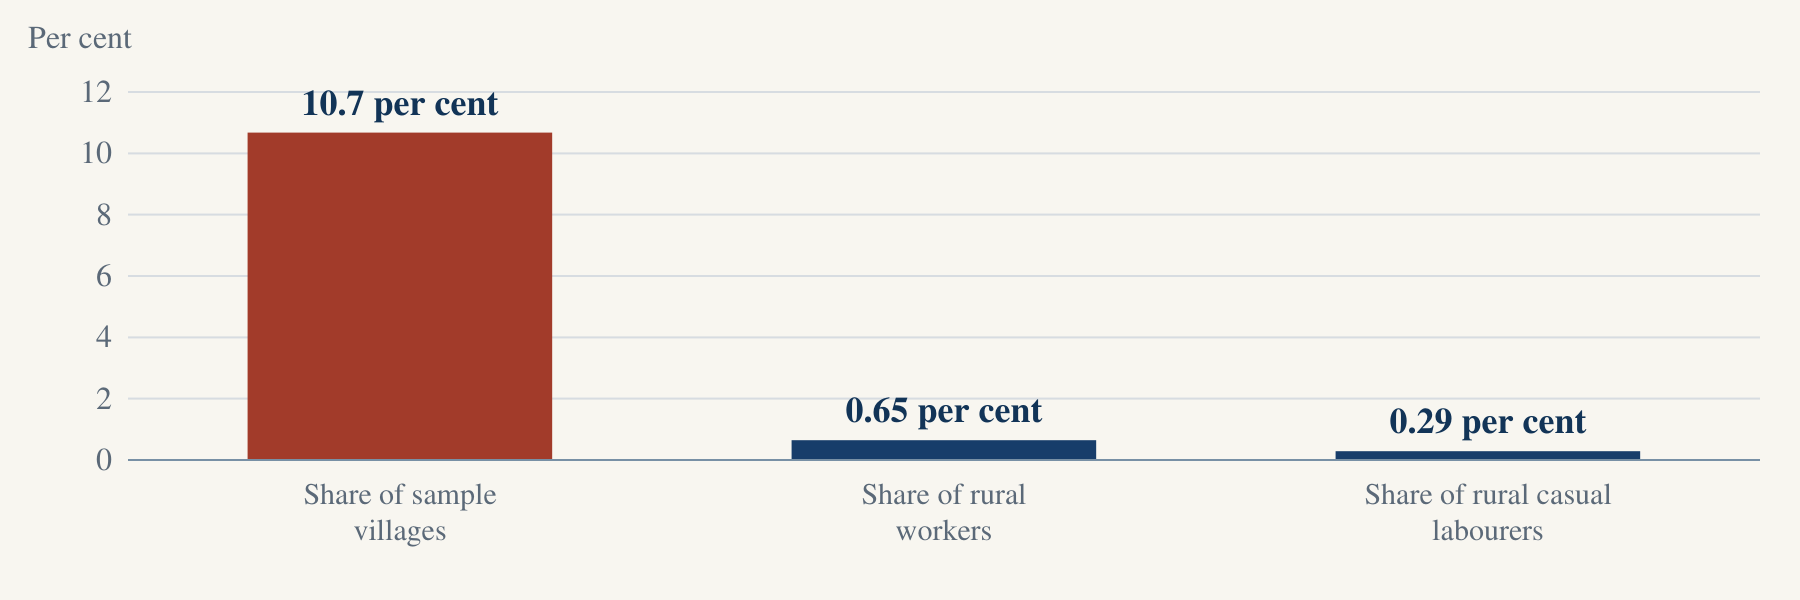
Ten small States and Union Territories now hold 10.7 per cent of the sample villages, although they have only 0.65 per cent of India's rural workers. When the same jobs are compared, nine of them pay more than the all-India average.
Source: Labour Bureau, rural wage table, July 2013 to August 2026, queried 20 October 2026 ; Labour Bureau, Detailed Note on the CPI-AL and CPI-RL base revision, 18 July 2025 ; MoSPI, PLFS 2025 unit-level data, catalogue 284, 2026 ; Labour Bureau, CPI-AL and CPI-RL press release for August 2026, 18 September 2026 .
Twelve months of a boom on paper
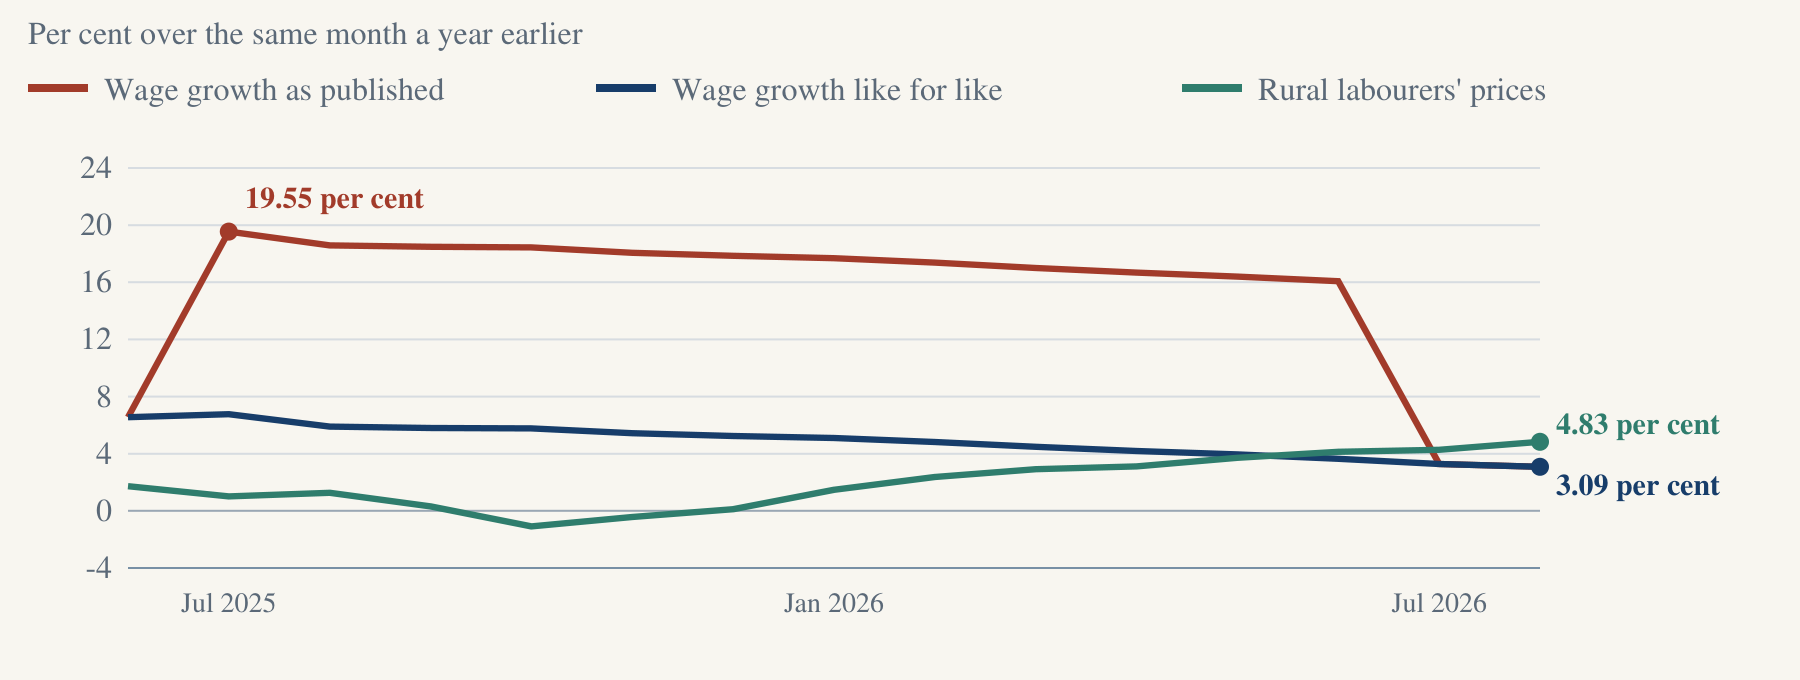
For twelve months the published growth ran at 16.07 to 19.55 per cent a year, because new villages were being set against old ones. When the same villages are compared, growth was 6.76 per cent in July 2025, falling to 3.65 per cent by June 2026.
Source: Labour Bureau, rural wage table, July 2013 to August 2026, queried 20 October 2026 ; Labour Bureau, Detailed Note on the CPI-AL and CPI-RL base revision, 18 July 2025 ; MoSPI, PLFS 2025 unit-level data, catalogue 284, 2026 ; Labour Bureau, CPI-AL and CPI-RL press release for August 2026, 18 September 2026 .
Real wages are now falling
From July 2026 both years come from the same villages. Wages rose 3.09 per cent in August 2026 while rural labourers' prices rose 4.83 per cent, so the real wage fell 1.66 per cent.
Source: Labour Bureau, rural wage table, July 2013 to August 2026, queried 20 October 2026 ; Labour Bureau, Detailed Note on the CPI-AL and CPI-RL base revision, 18 July 2025 ; MoSPI, PLFS 2025 unit-level data, catalogue 284, 2026 ; Labour Bureau, CPI-AL and CPI-RL press release for August 2026, 18 September 2026 .
What the Labour Bureau measures
Every month the Labour Bureau publishes the average daily wage paid in rural India, by State and by occupation. The Commission for Agricultural Costs and Prices uses these figures when it works out crop costs for minimum support prices, and the Reserve Bank uses them too, as the Bureau's own brief records.
| Question | The answer in the Bureau's own description |
|---|---|
| Who collects the wages | Field staff of the National Statistics Office visit the sample villages every month |
| Where | The same villages the Bureau uses for its price index for agricultural and rural labourers |
| Which jobs | 25 occupations, 12 in farming and 13 outside it, for men and women separately |
| How a State figure is made | The simple average of the wages reported by that State's villages |
| How the all-India figure is made | All village wages in the country added up and divided by the number of reports |
The last row matters most, because the all-India wage is not weighted by how many workers each State has. Each village report counts once, wherever it comes from.
Because each village report counts once, the number of villages in a State's sample decides its weight in the national figure, rather than the number of workers who live there. If the sample changes, the weights change with it, even when nobody decides to change them.
Source: Labour Bureau, Wage Rates in Rural India, A Brief (undated) .
What changed in July 2025
In July 2025 the Bureau moved its price index for agricultural and rural labourers to a new base year, 2019. With that change it chose a new sample of villages, and because it collects wages in the same villages, the wage series moved to the new villages too.
| Wages up to June 2025 | Wages from July 2025 | |
|---|---|---|
| Base year of the linked price index | 1986-87 | 2019 |
| Sample villages | 600 | 787 |
| States and Union Territories covered | 20 | 34 |
| Villages in the ten small States and Union Territories | 0 | 84 |
| Minimum villages for any State or Union Territory | no minimum | 8 |
The Bureau's table compares July 2025 in the new villages with July 2024 in the old villages, and those are different places. The Bureau published a linking factor for its price index, which is a number that joins the old series to the new one, but for wages it published none.
Source: Labour Bureau, Detailed Note on the CPI-AL and CPI-RL base revision, 18 July 2025 ; Labour Bureau, Index Review Committee report, September 2026 .
Ten small territories with a large say
Ten States and Union Territories had no villages in the old sample. They now hold 84 of the 787 villages, which is 10.7 per cent of the sample. Their share of India's rural workers is 0.65 per cent, and their share of rural casual labourers is 0.29 per cent.
| State or Union Territory | Villages | Share of rural workers | Occupations reported | Its average wage, men | All-India average, same occupations | Difference, per cent |
|---|---|---|---|---|---|---|
| Andaman and Nicobar Islands | 7 | 0.03 per cent | 11 | Rs 999.49 | Rs 563.57 | +77.35 |
| Sikkim | 8 | 0.08 per cent | 13 | Rs 762.81 | Rs 548.16 | +39.16 |
| Puducherry | 8 | 0.05 per cent | 11 | Rs 757.76 | Rs 557.62 | +35.89 |
| Lakshadweep | 5 | 0.00 per cent | 13 | Rs 715.59 | Rs 552.74 | +29.46 |
| Mizoram | 8 | 0.05 per cent | 21 | Rs 685.71 | Rs 515.57 | +33.00 |
| Goa | 8 | 0.05 per cent | 12 | Rs 653.65 | Rs 545.58 | +19.81 |
| Nagaland | 8 | 0.16 per cent | 13 | Rs 651.41 | Rs 528.15 | +23.34 |
| Delhi | 8 | 0.03 per cent | 12 | Rs 632.29 | Rs 550.48 | +14.86 |
| Arunachal Pradesh | 8 | 0.15 per cent | 16 | Rs 596.37 | Rs 529.48 | +12.63 |
| Dadra and Nagar Haveli and Daman and Diu | 16 | 0.04 per cent | 15 | Rs 482.44 | Rs 539.54 | -10.58 |
Each unit reports only some of the 25 occupations, so its wage is set against the all-India average for the same occupations in July 2025. Nine of the ten paid more, from 12.63 per cent more in Arunachal Pradesh to 77.35 per cent more in Andaman and Nicobar Islands, while Dadra and Nagar Haveli and Daman and Diu paid 10.58 per cent less. Adding the ten units together raised the national average by 4.57 points in that month, as the annexure on method shows.
Source: Labour Bureau, Index Review Committee report, September 2026 ; MoSPI, PLFS 2025 unit-level data, catalogue 284, 2026 ; Labour Bureau, rural wage table, July 2013 to August 2026, queried 20 October 2026 .
What the change did to the wage
The red line is the wage as the Bureau publishes it. It climbs gently for two years and then leaps by Rs 57.40 in one month, from Rs 453.51 to Rs 510.91. The dashed blue line shows the same months if the new villages are joined to the old series at the point of change, which is what the Bureau did for its price index.
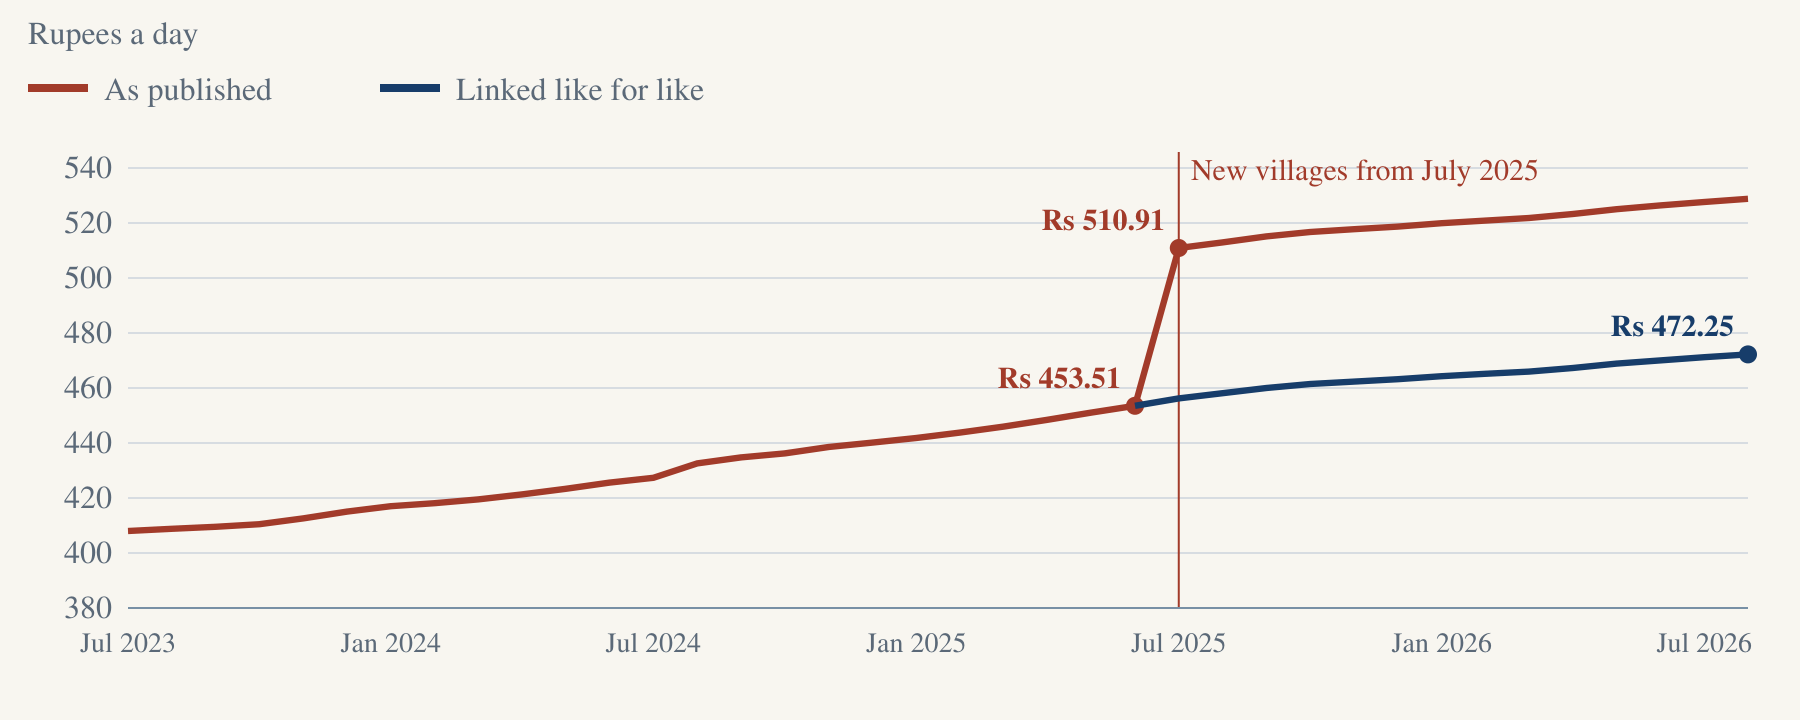
No other monthly rise of this size appears in the 25-occupation series, which began in November 2013. The next largest monthly rise in that series was 2.27 per cent, against 12.66 per cent in July 2025.
Source: Labour Bureau, rural wage table, July 2013 to August 2026, queried 20 October 2026 ; Labour Bureau, Detailed Note on the CPI-AL and CPI-RL base revision, 18 July 2025 ; Office of Shri Ajay Maken, calculations of 20 October 2026 .
Putting the old weights back is not enough
The Wire reported on 24 June 2026 that the jump came from the extra weight given to the ten small territories. That is part of the story. The chart shows rural wage growth in March 2026 worked out four ways.
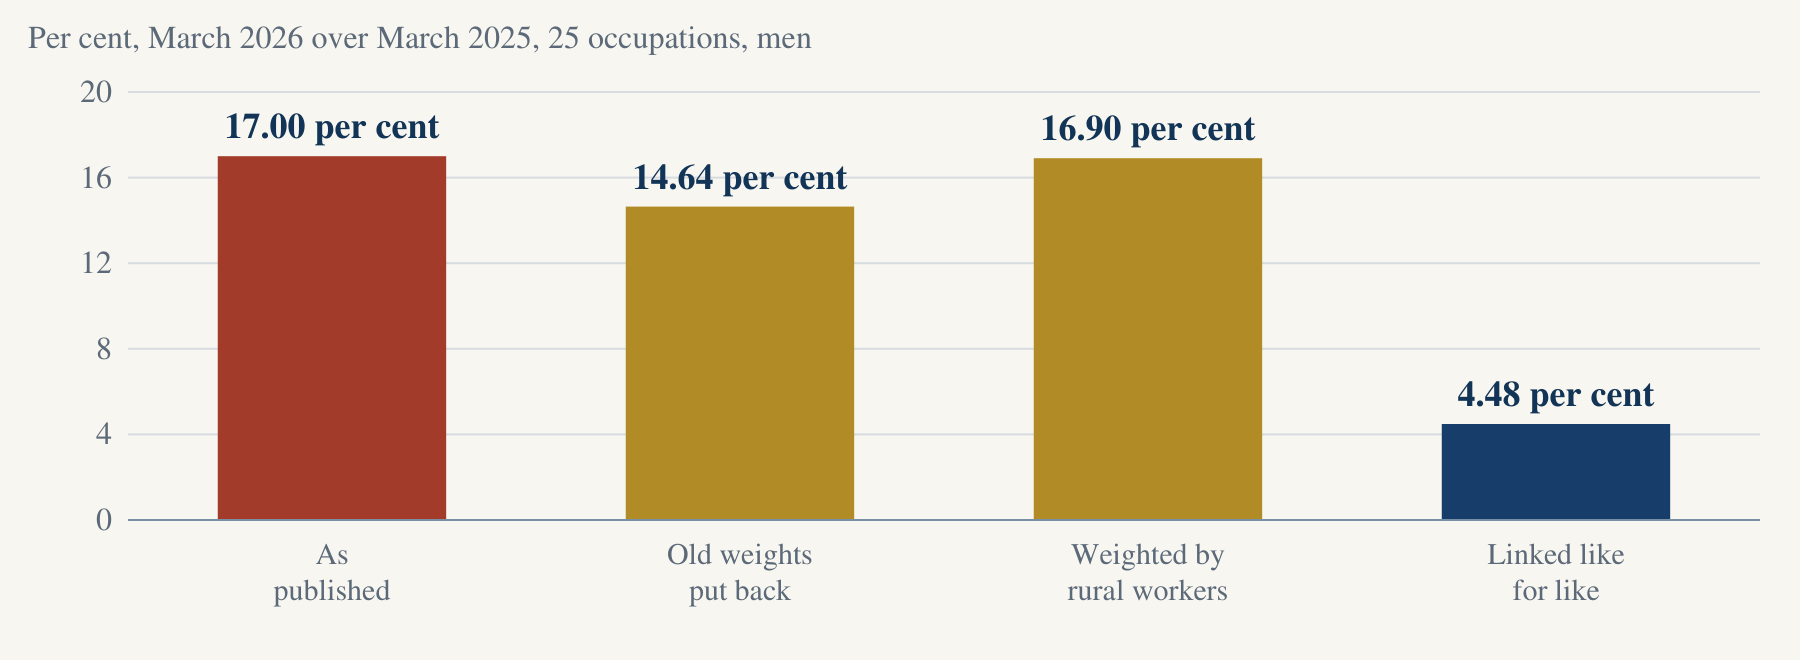
So the fault is larger than the weights. The ten small territories explain about a third of the July 2025 jump. Most of the rest came because the villages inside the same States were replaced, and the new villages report higher wages than the old ones did. When a sample changes in this way, statisticians join the old and new series with a link, and the Bureau gave none for wages.
Source: The Wire, article by M K Venu on the Systematix note, 24 June 2026 ; Labour Bureau, rural wage table, July 2013 to August 2026, queried 20 October 2026 ; MoSPI, PLFS 2025 unit-level data, catalogue 284, 2026 ; Office of Shri Ajay Maken, calculations of 20 October 2026 .
The true picture: wages on the same villages
For twelve months the published growth rate compared two different samples. From July 2026 the comparison is fair again, because both years come from the same 787 villages.
| Month | Wage growth, published | Wage growth, like for like | Prices, CPI-RL | Real wage, like for like |
|---|---|---|---|---|
| July 2025 | 19.55 per cent | 6.76 per cent | 1.01 per cent | +5.69 |
| December 2025 | 17.85 per cent | 5.25 per cent | 0.11 per cent | +5.13 |
| March 2026 | 17.00 per cent | 4.48 per cent | 2.92 per cent | +1.52 |
| June 2026 | 16.07 per cent | 3.65 per cent | 4.13 per cent | -0.46 |
| July 2026 | 3.27 per cent | 3.27 per cent | 4.27 per cent | -0.96 |
| August 2026 | 3.09 per cent | 3.09 per cent | 4.83 per cent | -1.66 |
Source: Labour Bureau, rural wage table, July 2013 to August 2026, queried 20 October 2026 ; Labour Bureau, CPI-AL and CPI-RL press release for August 2026, 18 September 2026 ; RBI, Database on Indian Economy, CPI-AL and CPI-RL indices, fetched 11 October 2026 ; Office of Shri Ajay Maken, calculations of 20 October 2026 .
What it means for rural workers
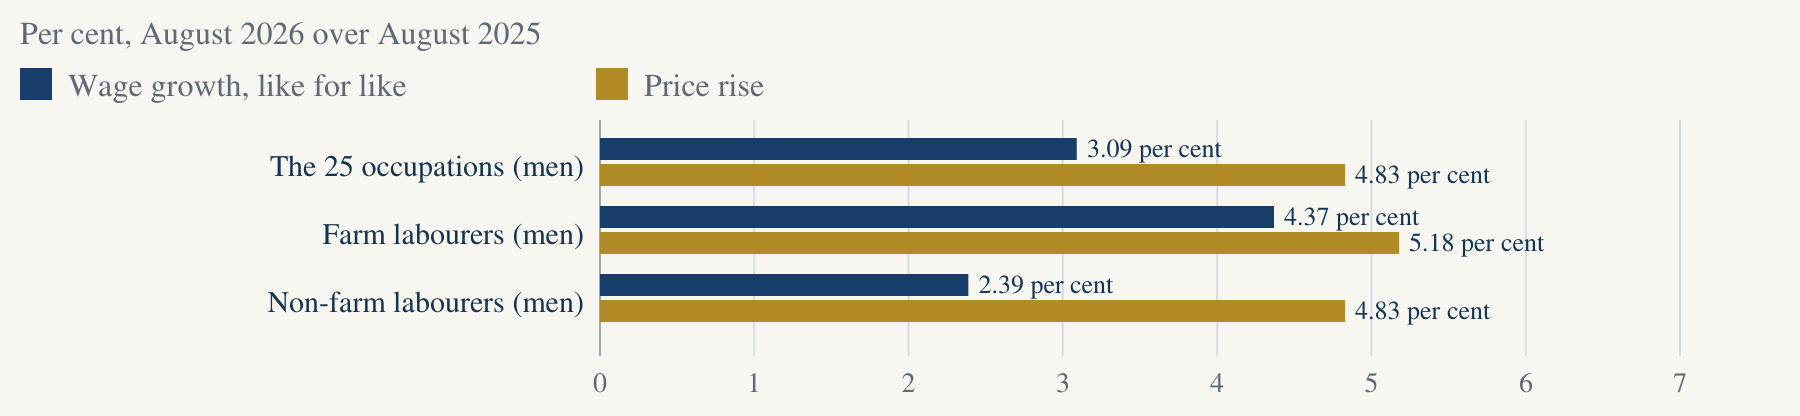
Comparing the same villages a year apart, wages of male farm labourers rose 4.37 per cent in August 2026, while their price index rose 5.18 per cent. Wages of male non-farm labourers rose 2.39 per cent, while their prices rose 4.83 per cent.
| Workers | Wage growth | Price rise | Real wage |
|---|---|---|---|
| The 25 occupations, men | 3.09 per cent | CPI-RL 4.83 per cent | -1.66 |
| General agricultural labourers, men | 4.37 per cent | CPI-AL 5.18 per cent | -0.77 |
| Non-agricultural labourers, men | 2.39 per cent | CPI-RL 4.83 per cent | -2.33 |
Prices are rising faster still: in September 2026 the price index for agricultural labourers rose 6.30 per cent and the index for rural labourers rose 5.98 per cent. The Bureau's wage figures for September are due on 30 October 2026.
Rural wages had fallen behind prices before the change as well. On the old villages, the real wage sat below its level a year earlier in every month from January to September 2024, by as much as 1.94 per cent on the Bureau's price index for agricultural labourers.
Source: Labour Bureau, rural wage table, July 2013 to August 2026, queried 20 October 2026 ; Labour Bureau, CPI-AL and CPI-RL press release for August 2026, 18 September 2026 ; Labour Bureau, CPI-AL and CPI-RL press release for September 2026, 19 October 2026 ; RBI, Database on Indian Economy, CPI-AL and CPI-RL indices, fetched 11 October 2026 .
What the Government must do
The rural wage series records what a day's work pays the poorest households, so an error in it misleads everyone who uses it. For a year it told a story of rising rural pay that the Bureau's own villages do not support. Five steps would set it right.
| What the Government must do | Why |
|---|---|
| Publish a linking factor and a back series for the wage data. | The Bureau did this for its price index on 18 July 2025, on the same change of villages, but not for wages. |
| Mark every growth rate across July 2025 as not comparable, in the table itself. | The table shows growth of 16.07 per cent to 19.55 per cent for twelve months, and the figures in the table carry no mark beside them. |
| Weight the all-India wage by rural workers, and publish the number of village reports behind each State average. | Ten territories that have 0.65 per cent of rural workers hold 10.7 per cent of the sample. |
| Tell Parliament where the July 2025 to June 2026 figures were used, and correct those uses. | The Bureau's brief names the Commission for Agricultural Costs and Prices and the Reserve Bank among the users of this series. |
| Explain why the wage series was not linked. | No document of the Bureau that this office found gives a reason. |
The annexures set out the method so fully that any statistician can repeat it from the Bureau's own table.
Source: Labour Bureau, Detailed Note on the CPI-AL and CPI-RL base revision, 18 July 2025 ; Labour Bureau, Wage Rates in Rural India, A Brief (undated) ; MoSPI, PLFS 2025 unit-level data, catalogue 284, 2026 .
Terms, explained
- Sample village
- A village chosen by the Labour Bureau for its monthly collection of prices and wages. From July 2025 there are 787 of them, in 34 States and Union Territories.
- All-India average wage
- The sum of every village's wage report divided by the number of reports, so each State counts by its number of sample villages.
- Like for like
- A comparison in which both months come from the same set of villages, so that a change of sample does not show up as a change in pay.
- Linked series
- The old series carried forward from June 2025 by its normal June to July move, and then moved by the new villages' own monthly changes.
- Real wage
- The wage after allowing for the rise in prices, measured with the Labour Bureau's price index for rural labourers, or for agricultural labourers in the case of farm work.
Downloads for readers and the press
Sources & method
Every figure comes from the Labour Bureau's own State-wise wage table, downloaded from its website on 20 October 2026, which runs from July 2013 to August 2026.
The Bureau's brief says that its all-India average is the sum of all village reports divided by their number. Weighting each State's average by its number of sample villages brings the Bureau's all-India figure back, so the sample sets the weights.
Wage growth is then worked out in three more ways: with the old village weights, with each State's share of rural workers in MoSPI's PLFS 2025, and as a linked series, which joins the new villages to the old series at July 2025.
Real wages for farm work use the Bureau's price index for agricultural labourers, while the other occupations use its index for rural labourers. Where the Bureau's press note prints a rate, that rate stands as printed.
- Labour Bureau, Wage Rates in Rural India, A Brief (undated) .
- Labour Bureau, Detailed Note on the CPI-AL and CPI-RL base revision, 18 July 2025 .
- Labour Bureau, Index Review Committee report, September 2026 .
- Labour Bureau, rural wage table, July 2013 to August 2026, queried 20 October 2026 .
- Labour Bureau, CPI-AL and CPI-RL press release for August 2026, 18 September 2026 .
- Labour Bureau, CPI-AL and CPI-RL press release for September 2026, 19 October 2026 .
- RBI, Database on Indian Economy, CPI-AL and CPI-RL indices, fetched 11 October 2026 .
- MoSPI, PLFS 2025 unit-level data, catalogue 284, 2026 .
- The Wire, article by M K Venu on the Systematix note, 24 June 2026 .
- Office of Shri Ajay Maken, calculations of 20 October 2026 .