Fuel minerals output
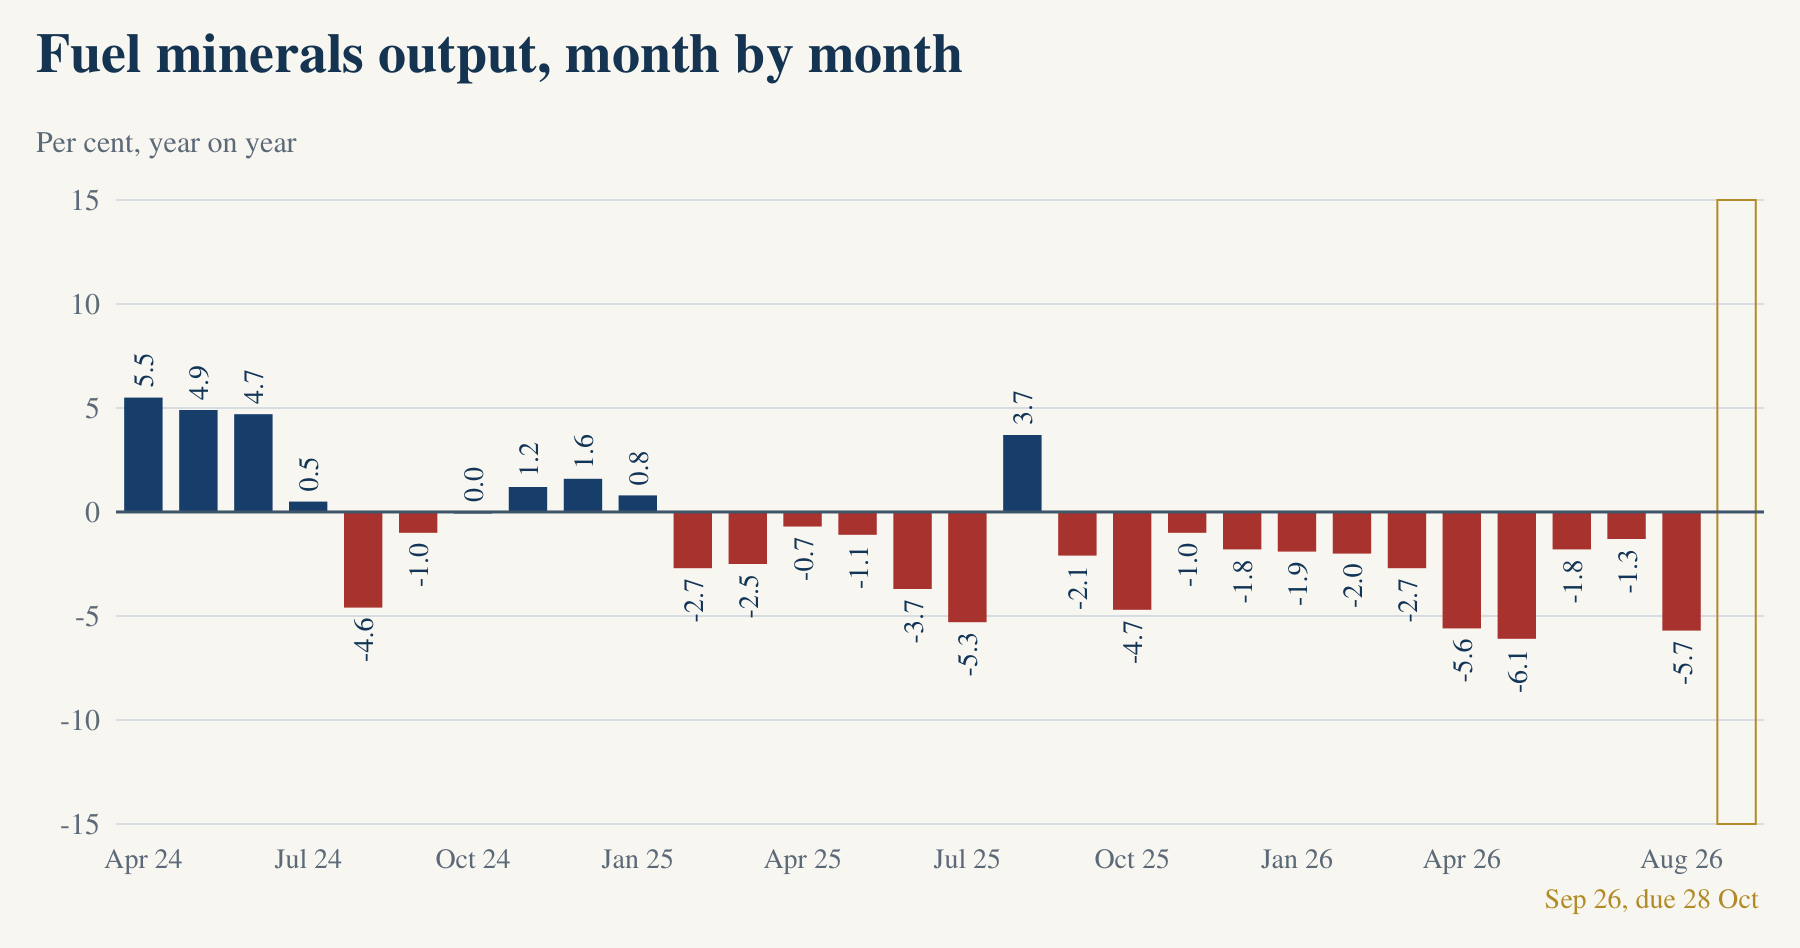
When each month is set against the same month a year earlier, as MoSPI measures it, fuel minerals output fell in every month from September 2025 to August 2026. The falls were 2.1, 4.7, 1.0, 1.8, 1.9, 2.0, 2.7, 5.6, 6.1, 1.8, 1.3 and 5.7 per cent, in that order.
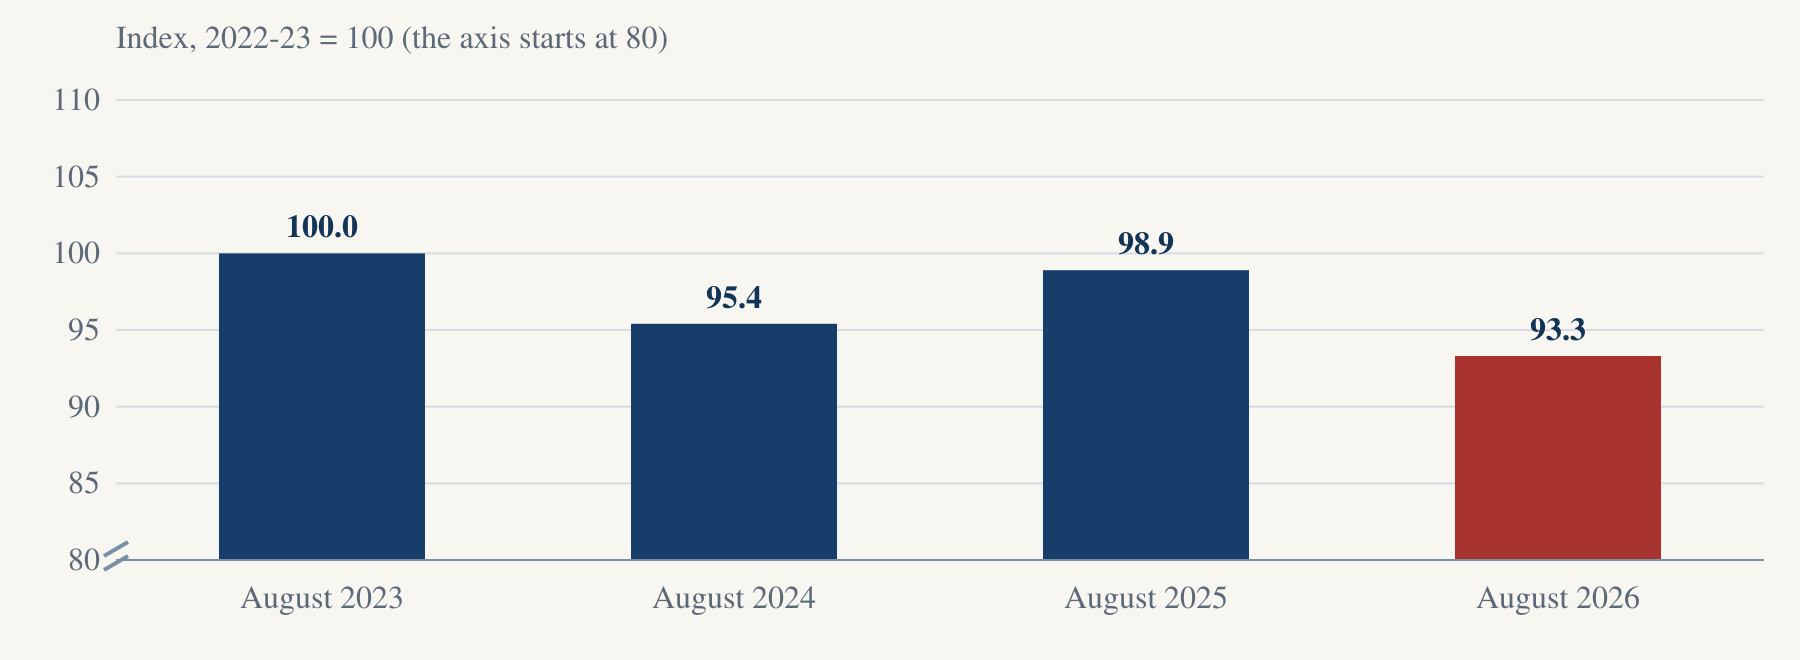
The fuel minerals index for August 2026 was 93.3, which is the lowest of the four Augusts since the series began in April 2023. Every figure here comes from MoSPI's Index of Industrial Production.
MoSPI releases the IIP for September 2026 on Wednesday, 28 October 2026, as its release of 28 September 2026 states.
The September 2026 figure will be read against September 2025 on the same 2022-23 series, which is when the fuel minerals index stood at 93.6. The run below a year earlier reaches a thirteenth month only if the growth rate that MoSPI prints for fuel minerals in September 2026 is below zero.
Source: MoSPI release for August 2026, 28 September 2026 ; MoSPI workbook, 2022-23 series, 28 September 2026 .
The essentials
Fuel minerals output was below its level of a year earlier in all twelve months from September 2025 to August 2026, and in August 2026 it was 5.7 per cent lower, on the quick estimate of the Ministry of Statistics and Programme Implementation (MoSPI). No run this long appears in the 29 months, April 2024 to August 2026, for which MoSPI's 2022-23 series prints the index of the same month a year earlier. The fuel minerals index for August 2026 was 93.3, which is the lowest of the four Augusts since the series began in April 2023. Every figure here comes from MoSPI's Index of Industrial Production.
Source: MoSPI release for August 2026, 28 September 2026 ; MoSPI workbook, 2022-23 series, 28 September 2026 .
Fuel minerals, August 2026
Fuel minerals output was below its level of a year earlier in all twelve months from September 2025 to August 2026, and in August 2026 it was 5.7 per cent lower, on the quick estimate of the Ministry of Statistics and Programme Implementation (MoSPI). MoSPI's 2022-23 series prints the index of the same month a year earlier for 29 months, April 2024 to August 2026, and no run this long appears in them.
Source: MoSPI release for August 2026, 28 September 2026 ; MoSPI workbook, 2022-23 series, 28 September 2026 .
The lowest August
The fuel minerals index stood at 93.3 in August 2026. It was 98.9 in August 2025, 95.4 in August 2024 and 100.0 in August 2023.
Source: MoSPI release for August 2026, 28 September 2026 ; MoSPI workbook, 2022-23 series, 28 September 2026 .
Mining
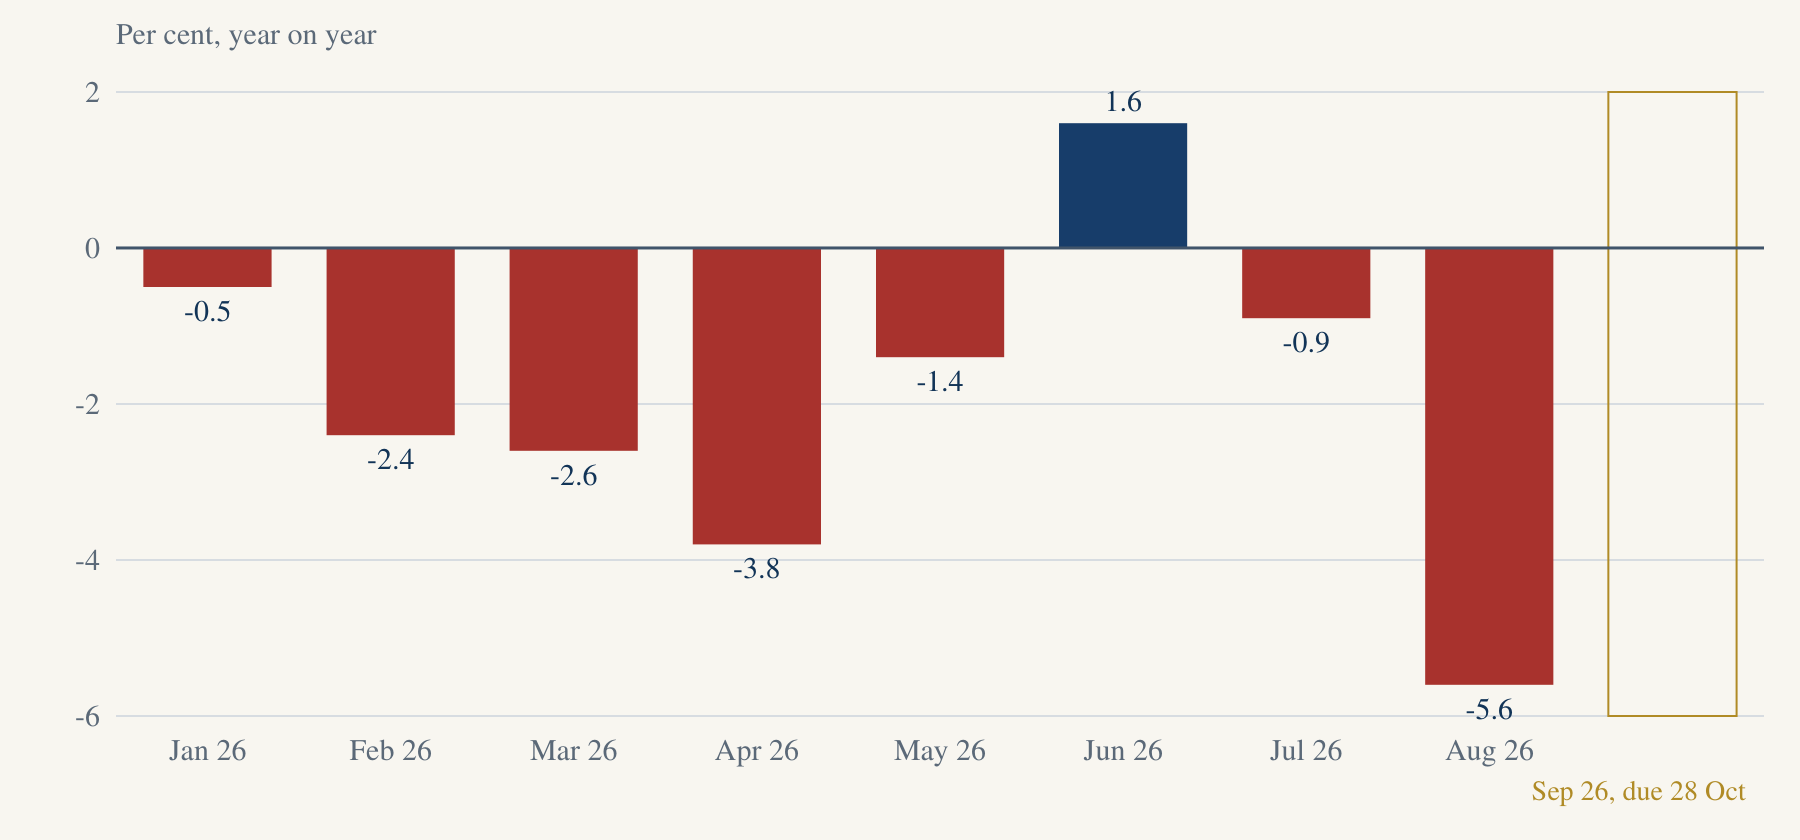
Mining output as a whole fell 5.6 per cent in August 2026 from August 2025, on the quick estimate, and that is the steepest fall in the same 29 months.
Source: MoSPI release for August 2026, 28 September 2026 ; MoSPI workbook, 2022-23 series, 28 September 2026 .
Wearing apparel
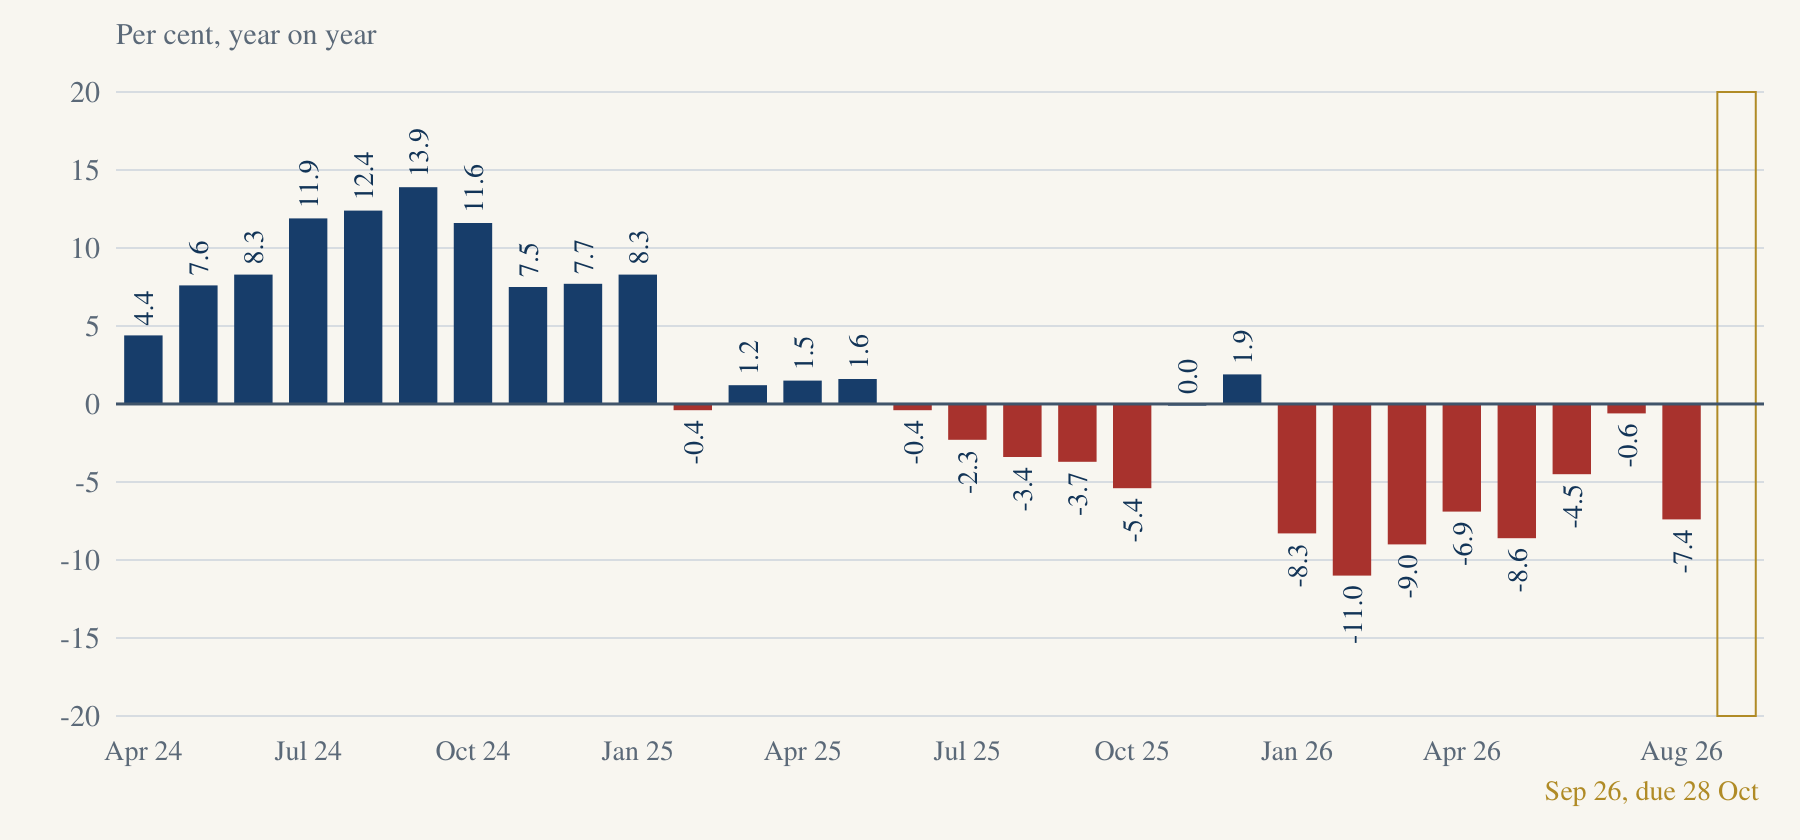
Wearing apparel output has been lower than a year earlier in each of the eight months since January 2026, a run that reaches August 2026.
Source: MoSPI release for August 2026, 28 September 2026 ; MoSPI workbook, 2022-23 series, 28 September 2026 .
April to August 2026
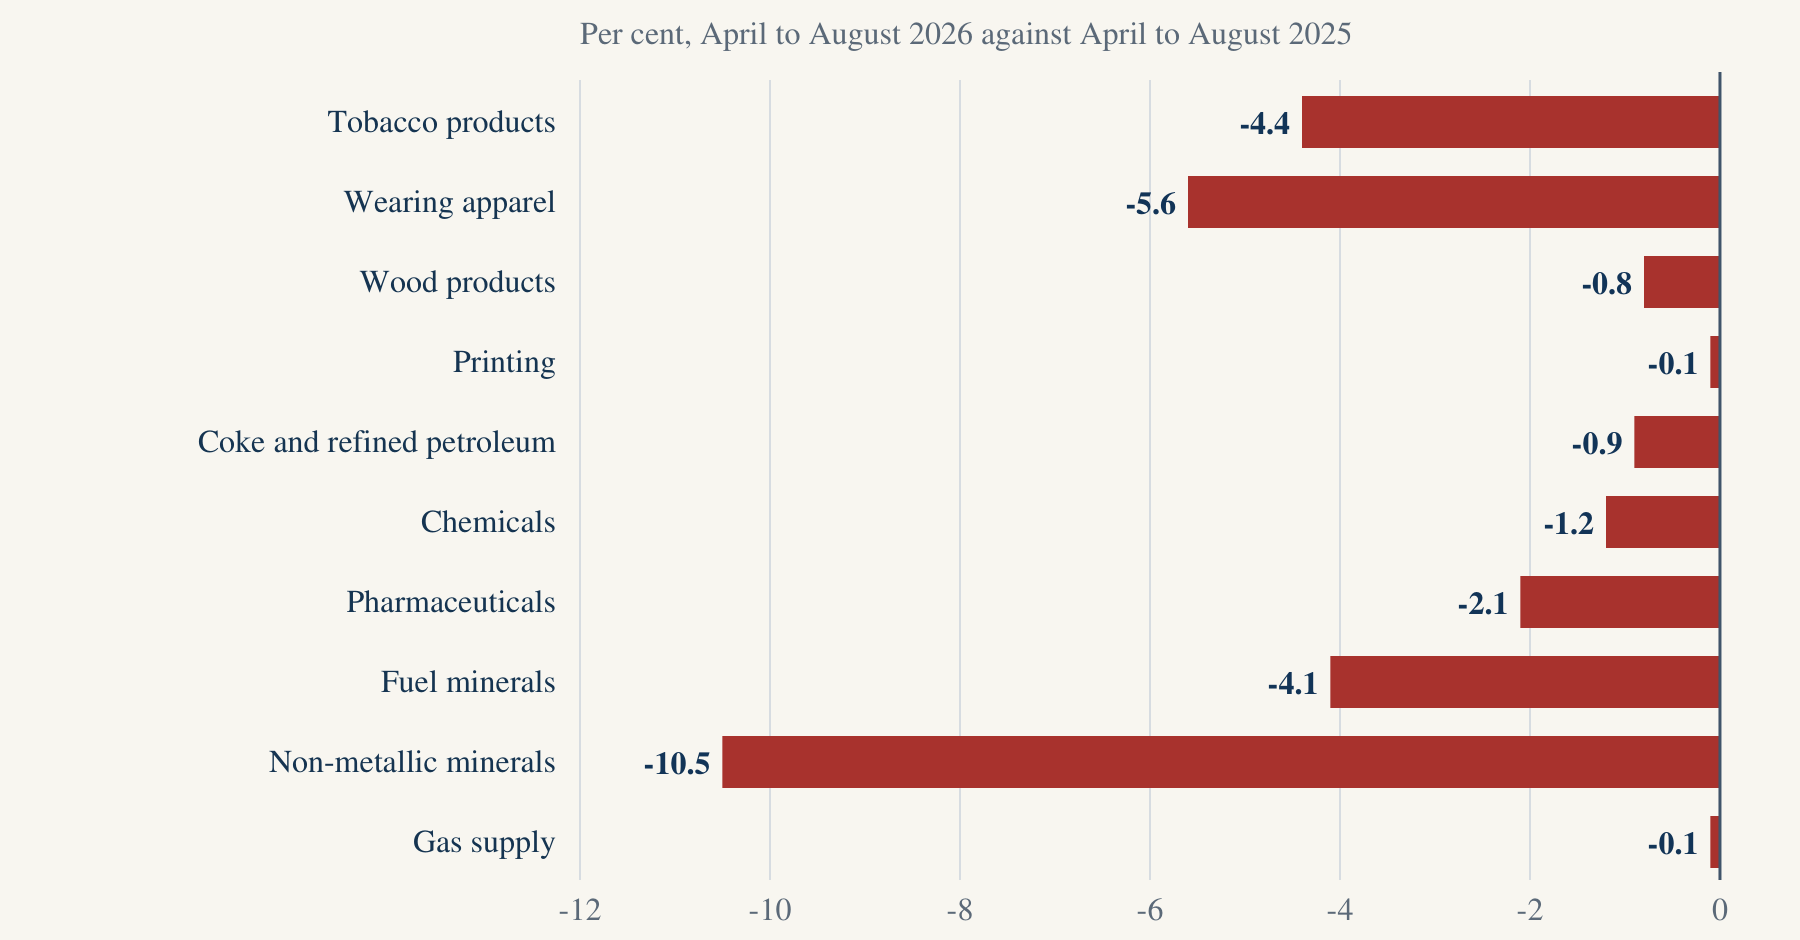
When MoSPI's figures for April to August 2026 are set against the same months of 2025, they show that seven of the 23 manufacturing industry groups produced less. The seven were tobacco products, wearing apparel, wood products, printing, coke and refined petroleum products, chemical products, and pharmaceuticals.
A series replaced in four weeks
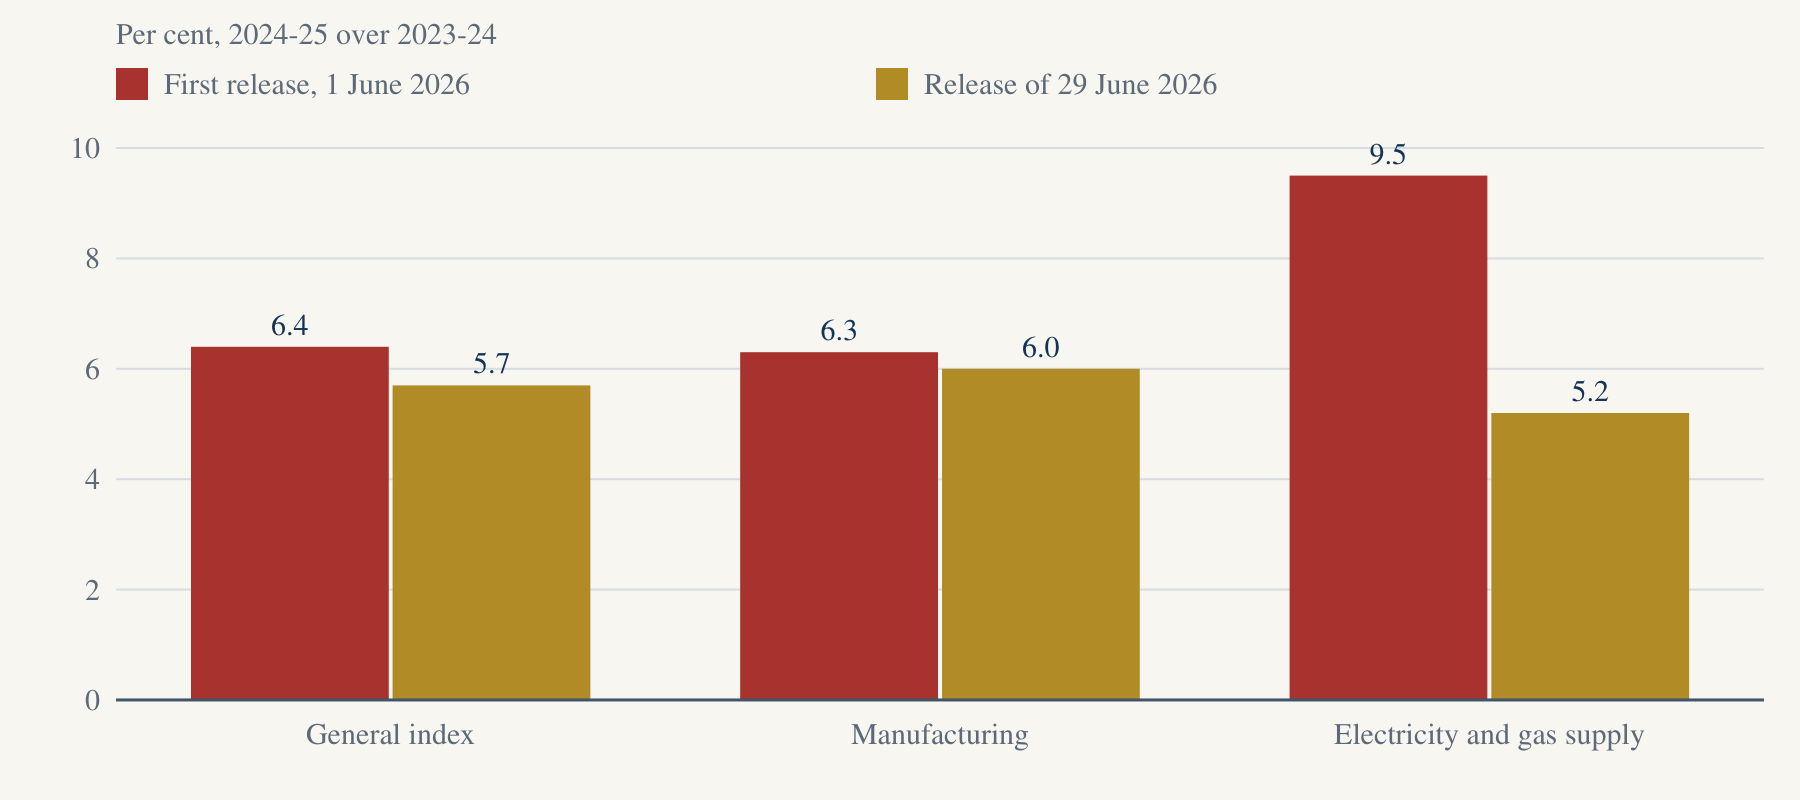
MoSPI replaced its new series four weeks after launching it. Its first figure for the general index's growth in 2024-25 was 6.4 per cent, and the replacement prints 5.7 per cent.
Source: MoSPI first release, 1 June 2026 ; MoSPI release for May 2026, 29 June 2026 .
Fuel minerals output, month by month
When each month is set against the same month a year earlier, as MoSPI measures it, fuel minerals output fell in every month from September 2025 to August 2026. The falls were 2.1, 4.7, 1.0, 1.8, 1.9, 2.0, 2.7, 5.6, 6.1, 1.8, 1.3 and 5.7 per cent, in that order.
Source: MoSPI workbook, 2022-23 series, 28 September 2026 . Each observation's dated source is linked in its CSV row.
View the figures in a table
On the quick estimate, the fall in August 2026 is the second steepest of the 29 months, and only May 2026 fell further, when output was 6.1 per cent lower.
Fuel minerals are the part of mining that MoSPI lists under the codes 05 and 06 of its National Industrial Classification 2025. Those two divisions are the mining of coal and lignite and the extraction of crude petroleum and natural gas.
The fuel minerals index in August of each year
The fuel minerals index stood at 93.3 in August 2026. It was 98.9 in August 2025, 95.4 in August 2024 and 100.0 in August 2023.
Source: MoSPI workbook, 2022-23 series, 28 September 2026 ; MoSPI release for August 2026, 28 September 2026 . Each observation's dated source is linked in its CSV row.
View the figures in a table
| Observation | Value | Official source |
|---|---|---|
| August 2023 | 100.0 | MoSPI workbook, 2022-23 series, 28 September 2026 |
| August 2024 | 95.4 | MoSPI workbook, 2022-23 series, 28 September 2026 |
| August 2025 | 98.9 | MoSPI workbook, 2022-23 series, 28 September 2026 |
| August 2026 | 93.3 | MoSPI workbook, 2022-23 series, 28 September 2026 |
The average fuel minerals index for April to August was 96.3 in 2026, which compares with 100.4 in 2025, 101.9 in 2024 and 99.8 in 2023. That makes this year's figure the lowest of the four years on the series.
Over the financial year 2025-26, fuel minerals output was 2.0 per cent below its level of 2024-25, as MoSPI's workbook of 28 September 2026 prints it.
Mining, the steepest fall in 29 months
Mining output fell 5.6 per cent in August 2026, when it is set against August 2025, and the figure is a quick estimate. That is the steepest fall in the 29 months for which the 2022-23 series prints the index of the same month a year earlier. When MoSPI compares April to August 2026 with the same months of 2025, it puts mining output 2.0 per cent lower, and the latest month is a quick estimate.
Source: MoSPI workbook, 2022-23 series, 28 September 2026 ; MoSPI release for August 2026, 28 September 2026 . Each observation's dated source is linked in its CSV row.
View the figures in a table
| Observation | Value | Official source |
|---|---|---|
| Jan 26 | -0.5 | MoSPI workbook, 2022-23 series, 28 September 2026 |
| Feb 26 | -2.4 | MoSPI workbook, 2022-23 series, 28 September 2026 |
| Mar 26 | -2.6 | MoSPI workbook, 2022-23 series, 28 September 2026 |
| Apr 26 | -3.8 | MoSPI workbook, 2022-23 series, 28 September 2026 |
| May 26 | -1.4 | MoSPI workbook, 2022-23 series, 28 September 2026 |
| Jun 26 | 1.6 | MoSPI workbook, 2022-23 series, 28 September 2026 |
| Jul 26 | -0.9 | MoSPI workbook, 2022-23 series, 28 September 2026 |
| Aug 26 | -5.6 | MoSPI workbook, 2022-23 series, 28 September 2026 |
When each month of 2026 is set against the same month a year earlier, mining output was lower in seven of the eight months that MoSPI has released.
Within mining, the output of non-metallic minerals, which include the minor minerals, fell 12.8 per cent in August 2026. It has been lower than a year earlier in each of the nine months since December 2025, a run that reaches August 2026.
Wearing apparel
Wearing apparel output has been lower than a year earlier in each of the eight months since January 2026, which is a run that reaches August 2026. No run this long appears in the 29 months, April 2024 to August 2026, for which the 2022-23 series prints the index of the same month a year earlier. In August 2026 it was 7.4 per cent below August 2025, and that figure is a quick estimate. When MoSPI compares April to August 2026 with the same months of 2025, it puts the output of wearing apparel 5.6 per cent lower.
Source: MoSPI workbook, 2022-23 series, 28 September 2026 ; MoSPI release for August 2026, 28 September 2026 . Each observation's dated source is linked in its CSV row.
View the figures in a table
On MoSPI's older 2011-12 series, which is read here on its own, wearing apparel output was below its level of a year earlier in each of the eight months from August 2025 to March 2026, which is the last month that series gives.
Industries that produced less than a year earlier
When MoSPI's figures for April to August 2026 are set against the same months of 2025, they show that seven of the 23 manufacturing industry groups produced less. The seven were tobacco products, wearing apparel, wood products, printing, coke and refined petroleum products, chemical products, and pharmaceuticals.
Source: MoSPI release for August 2026, 28 September 2026 . Each observation's dated source is linked in its CSV row.
View the figures in a table
| Observation | Value | Official source |
|---|---|---|
| Tobacco products | -4.4 | MoSPI release for August 2026, 28 September 2026 |
| Wearing apparel | -5.6 | MoSPI release for August 2026, 28 September 2026 |
| Wood products | -0.8 | MoSPI release for August 2026, 28 September 2026 |
| Printing | -0.1 | MoSPI release for August 2026, 28 September 2026 |
| Coke and refined petroleum | -0.9 | MoSPI release for August 2026, 28 September 2026 |
| Chemicals | -1.2 | MoSPI release for August 2026, 28 September 2026 |
| Pharmaceuticals | -2.1 | MoSPI release for August 2026, 28 September 2026 |
| Fuel minerals | -4.1 | MoSPI release for August 2026, 28 September 2026 |
| Non-metallic minerals | -10.5 | MoSPI release for August 2026, 28 September 2026 |
| Gas supply | -0.1 | MoSPI release for August 2026, 28 September 2026 |
In mining, fuel minerals and non-metallic minerals produced less over the same months, and so did gas supply.
A new series replaced four weeks after its launch
MoSPI released the first figures of its new series on 1 June 2026, and that series used the base year 2022-23. Four weeks later, on 29 June 2026, it replaced the whole series with one that uses a different deflator. MoSPI's figure for the growth of the general index in 2024-25 was 6.4 per cent in the first release, and it is 5.7 per cent in the series that replaced it. For electricity and gas supply, the same year's growth was 9.5 per cent in the first release and is 5.2 per cent now.
Source: MoSPI first release, 1 June 2026 ; MoSPI release for May 2026, 29 June 2026 . Each observation's dated source is linked in its CSV row.
View the figures in a table
| Observation | Value | Official source |
|---|---|---|
| General index | 5.7 | MoSPI release for May 2026, 29 June 2026 |
| Manufacturing | 6.0 | MoSPI release for May 2026, 29 June 2026 |
| Electricity and gas supply | 5.2 | MoSPI release for May 2026, 29 June 2026 |
Its release of that day says: "MoSPI has now revised and released the entire IIP 2022-23 series with Output PPI and it supersedes the earlier WPI based IIP ... series released on 1st June 2026." The words left out are the series' base year, which the release prints with a dash.
The release of 29 June 2026 says that the change of deflator affects 234 of the 463 item groups, which carry 36.02 per cent of the total index weight. It adds that "the Electricity Index has also undergone revision to address a compilation issue related to its sub-sectoral weights".
Fuel minerals, month by month
When each month is set against the same month a year earlier, as MoSPI measures it, fuel minerals output fell in every month from September 2025 to August 2026. The falls were 2.1, 4.7, 1.0, 1.8, 1.9, 2.0, 2.7, 5.6, 6.1, 1.8, 1.3 and 5.7 per cent, in that order.
Each figure shows how far fuel minerals output fell below the level that it reached in the same month a year earlier, as MoSPI measures it.
Fuel minerals are the part of mining that MoSPI lists under the codes 05 and 06 of its National Industrial Classification 2025. Those two divisions are the mining of coal and lignite and the extraction of crude petroleum and natural gas.
MoSPI's own figures show that fuel minerals output was lower than a year earlier in every month from September 2025 to August 2026, and that in August 2026, which is the latest quick estimate, it was 5.7 per cent lower.
Terms, explained
- Index of Industrial Production
- The Ministry of Statistics and Programme Implementation (MoSPI) measures the output of mining, manufacturing, electricity and gas supply, and water supply and waste management each month. The year 2022-23 is set to 100.
- Fuel minerals
- The part of mining that MoSPI lists under the codes 05 and 06 of its National Industrial Classification 2025, which are the mining of coal and lignite and the extraction of crude petroleum and natural gas.
- Growth rate
- MoSPI compares a month's index with the same month a year earlier, and a negative rate means that output fell.
- April to a month
- MoSPI averages the months from April, which starts the financial year, and compares that average with the same months a year earlier.
- Quick estimate
- The latest month is a quick estimate, and MoSPI prints its final figure a month later.
Downloads for readers and the press
Sources & method
Every figure on output in this brief comes from the All India Index of Industrial Production (IIP), which the Ministry of Statistics and Programme Implementation (MoSPI) publishes. MoSPI measures the output of mining, manufacturing, electricity and gas supply, and water supply and waste management each month, and it publishes an index for each part, where the year 2022-23 is set to 100.
A growth rate here is MoSPI's own, which compares a month's index with the same month a year earlier. Where a figure covers April to a month, it compares the average of those months with the same months a year earlier.
MoSPI moved the index to the base year 2022-23 on 1 June 2026, and it replaced that first series on 29 June 2026. Every figure here is on the series in use since 29 June, except the first release's figures, which are named as such. Its workbook prints the index from April 2023, so a month can be set against the same month a year earlier only from April 2024. MoSPI set every month of the base year 2022-23 to 100, so the growth rate that the workbook prints for a month of 2023-24 is that month's index less 100. The older series, on the base 2011-12, ran to March 2026, and this brief reads it on its own and never joins the two.
This brief works out four kinds of figure from MoSPI's own. The first is a run of months in which output was lower than a year earlier, and the second is where a month ranks against the other months of its series. The third is the April to August average of 2023 and of 2024, and the fourth is the count of industry groups that produced less. It prints every other figure as MoSPI prints it, to one decimal. The latest month is a quick estimate, and MoSPI prints its final figure a month later.
- MoSPI release for August 2026, 28 September 2026 .
- MoSPI workbook, 2022-23 series, 28 September 2026 .
- MoSPI first release, 1 June 2026 .
- MoSPI release for May 2026, 29 June 2026 .
- MoSPI National Industrial Classification 2025 .
- eSankhyiki 2011-12 monthly, page 2 .