The September figure, due on 14 October 2026
The Office of the Economic Adviser (OEA), in the Ministry of Commerce and Industry, releases the Wholesale Price Index for September 2026 on 14 October 2026. The OEA put August's rate at 9.92 per cent in its release of 14 September 2026, and marks that figure provisional.
The OEA computes the rate from indices printed to one decimal place. August's index was 110.8, and a September index of 111.1 or more would give a rate of at least 10.00 per cent. So any September rate above August's 9.92 per cent would be in double digits, and on the figures published so far it would be the highest since September 2022. At 111.8 or more the rate would be at least 10.69 per cent, the highest since August 2022, and at 113.7 or more it would be at least 12.57 per cent, the highest since July 2022.
For manufactured products, a September index of 108.9 or more would keep the rate higher than in the month before for the tenth month in a row. For the food index, 118.7 or more would do so for the eleventh.
| If the September 2026 index is | The rate would be at least | It would be the highest since |
|---|---|---|
| 111.1 or more | 10.00 per cent | September 2022 |
| 111.8 or more | 10.69 per cent | August 2022 |
| 113.7 or more | 12.57 per cent | July 2022 |
Source: OEA, WPI press release of 14 September 2026 ; OEA, WPI monthly index, base 2022-23 ; OEA, WPI monthly index, base 2011-12, file of 15 July 2026 .
The essentials
In the year to August 2026 wholesale prices rose 9.92 per cent. Fuel and power rose 22.93 per cent, while manufactured products rose 8.37 per cent and primary articles 7.76 per cent. The rate for the OEA's food index was 7.05 per cent, and it has risen for ten months in a row.
Source: OEA, WPI press release of 14 September 2026 ; OEA, WPI monthly index, base 2022-23 .
The four highest since September 2022
The rate was 9.88 per cent in May, 9.97 per cent in June, 9.78 per cent in July and 9.92 per cent in August. From October 2022 to April 2026 the rate never reached 9 per cent on either of the OEA's two series, so each of the four months stood more than a point above every month in that period.
Source: OEA, WPI press release of 14 September 2026 ; OEA, WPI monthly index, base 2022-23 ; OEA, WPI monthly index, base 2011-12, file of 15 July 2026 ; OEA, WPI press release of 16 January 2023 ; OEA, WPI press release of 14 December 2022 .
Food: the rate higher for ten months in a row
In each of the ten months from November 2025 to August 2026, the OEA's food index rate was higher than in the month before, and in August it reached 7.05 per cent. No earlier run in the food index, whose rates begin in April 2013, has lasted as long.
Source: OEA, WPI press release of 14 September 2026 ; OEA, WPI monthly index, base 2022-23 ; OEA, WPI monthly index, base 2011-12, file of 15 July 2026 .
Manufactured goods: nine rises in a row
Manufactured products carry 63.13 per cent of the index. Their rate was higher than in the month before in each of the nine months from December 2025 to August 2026, and it reached 8.37 per cent.
Source: OEA, WPI press release of 14 September 2026 ; OEA, WPI monthly index, base 2022-23 .
Fuel and power up 22.93 per cent
On the OEA's index, wholesale fuel and power prices rose 22.93 per cent in the year to August 2026, more than twice the all-commodities rate of 9.92 per cent.
What the September figure would be the highest since
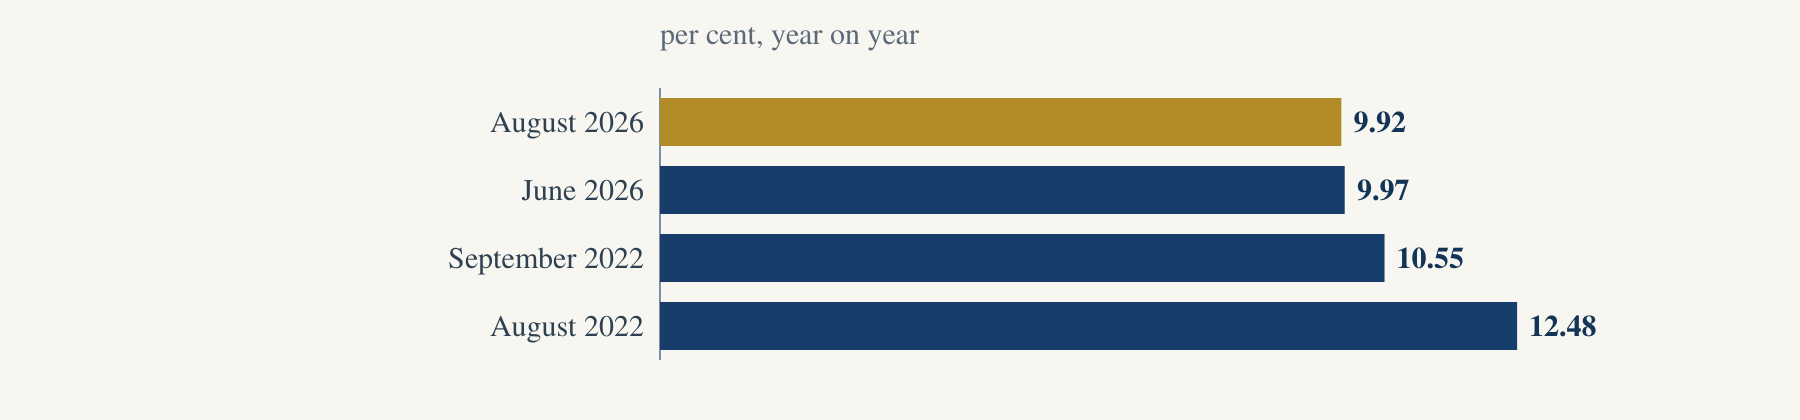
Each bar is a month that a September figure would have to pass. August 2026 stands at 9.92 per cent. June 2026 reached 9.97 per cent, September 2022 reached 10.55 per cent, and August 2022 reached 12.48 per cent.
Source: OEA, WPI press release of 14 September 2026 ; OEA, WPI monthly index, base 2022-23 ; OEA, WPI monthly index, base 2011-12, file of 15 July 2026 . Each observation's dated source is linked in its CSV row.
View the figures in a table
| Observation | Value | Official source |
|---|---|---|
| August 2026 | 9.92 | 2026-09-14 |
| June 2026 | 9.97 | 2026-09-14 |
| September 2022 | 10.55 | 2022-12-14 |
| August 2022 | 12.48 | 2026-07-15 |
Eight months of 2026
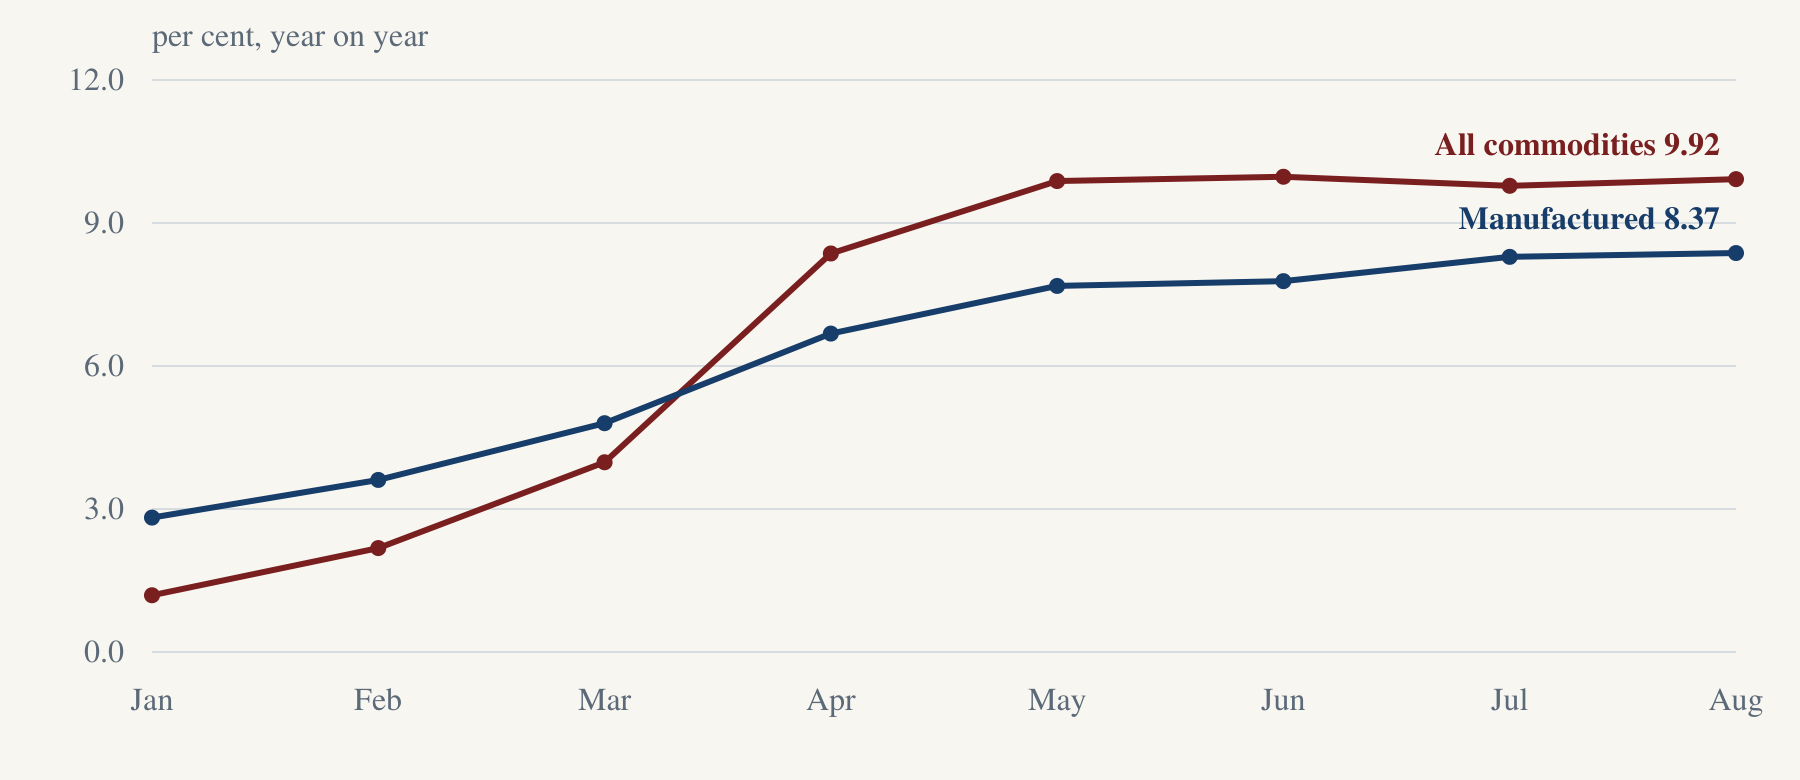
The all-commodities rate was 1.19 per cent in January 2026 and 9.92 per cent in August. The rate for manufactured products, which carry 63.13 per cent of the index, rose in every month of 2026, from 2.82 per cent in January to 8.37 per cent in August. The index itself rose from 101.9 in December 2025 to 110.8 in August 2026, so wholesale prices rose 8.73 per cent in eight months.
Source: OEA, WPI press release of 14 September 2026 ; OEA, WPI monthly index, base 2022-23 . Each observation's dated source is linked in its CSV row.
View the figures in a table
| Observation | Value | Official source |
|---|---|---|
| January 2026 | 1.19 | 2026-09-14 |
| February 2026 | 2.18 | 2026-09-14 |
| March 2026 | 3.98 | 2026-09-14 |
| April 2026 | 8.36 | 2026-09-14 |
| May 2026 | 9.88 | 2026-09-14 |
| June 2026 | 9.97 | 2026-09-14 |
| July 2026 | 9.78 | 2026-09-14 |
| August 2026 | 9.92 | 2026-09-14 |
Fuel and power rose fastest
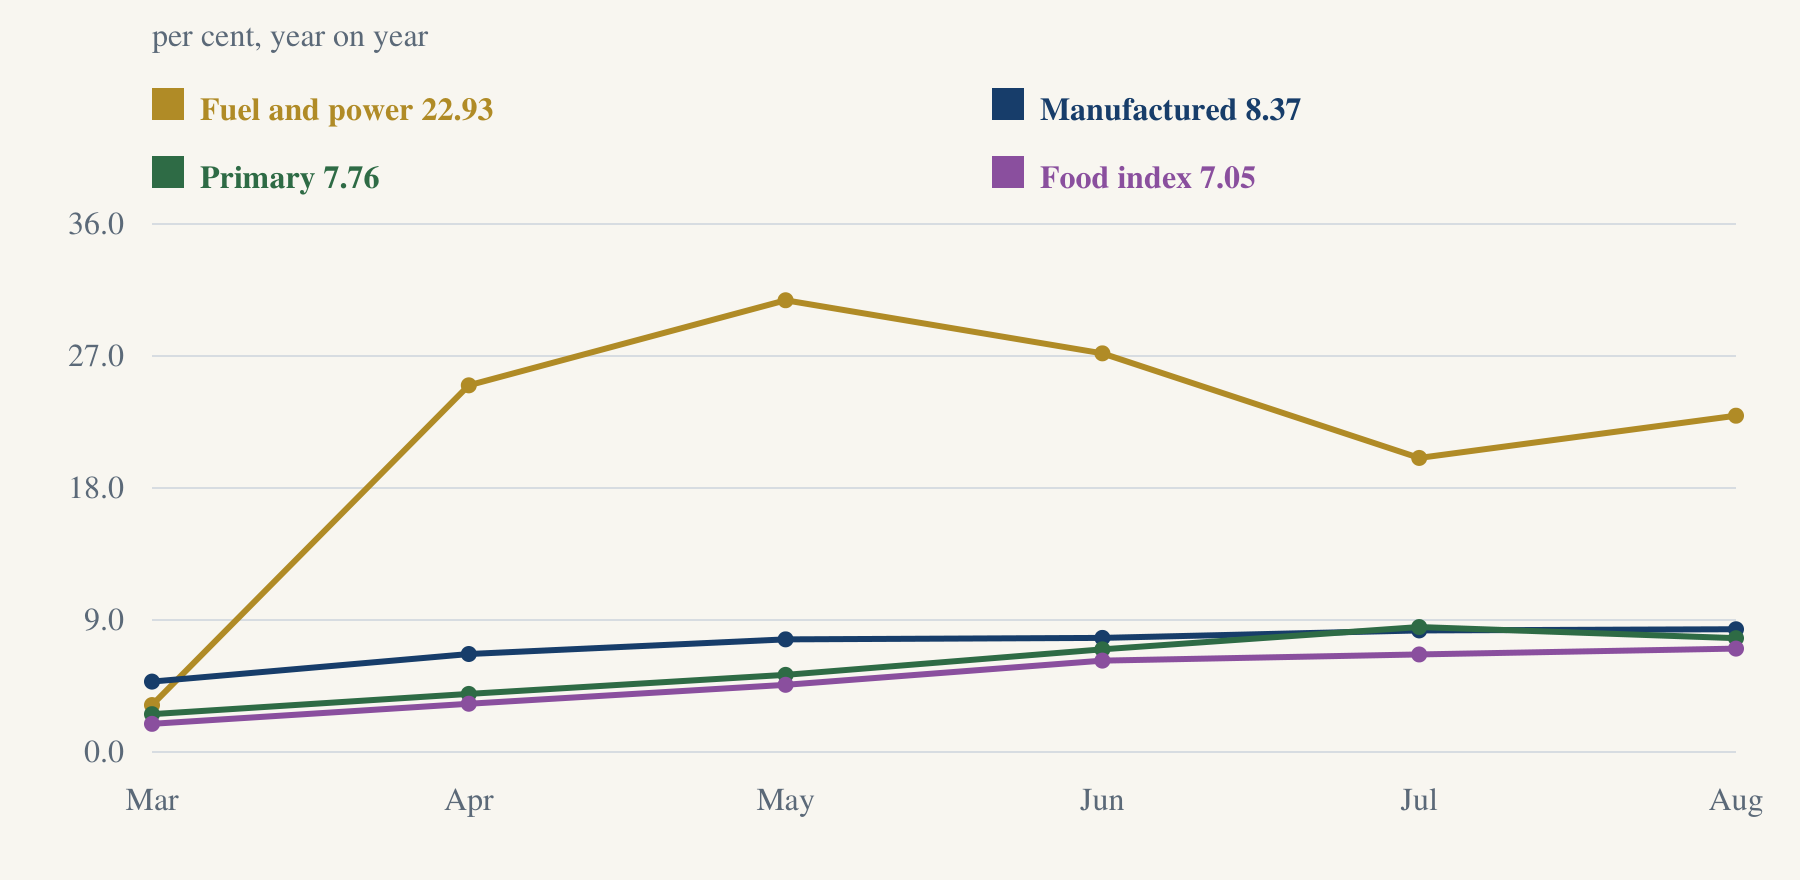
On the OEA's index, fuel and power rose 22.93 per cent in the year to August 2026, more than twice the all-commodities rate. Manufactured products rose 8.37 per cent, primary articles 7.76 per cent and the food index 7.05 per cent.
Source: OEA, WPI press release of 14 September 2026 ; OEA, WPI monthly index, base 2022-23 . Each observation's dated source is linked in its CSV row.
View the figures in a table
| Observation | Value | Official source |
|---|---|---|
| March 2026 | 3.2 | 2026-09-14 |
| April 2026 | 25.0 | 2026-09-14 |
| May 2026 | 30.8 | 2026-09-14 |
| June 2026 | 27.18 | 2026-09-14 |
| July 2026 | 20.05 | 2026-09-14 |
| August 2026 | 22.93 | 2026-09-14 |
Inside fuel and power, mineral oils rose 38.48 per cent, and they carry 8.19 per cent of the index.
The OEA's release says that six groups "have been major drivers of WPI inflation in August 2026". In its own words they are "Mineral Oils (containing Petroleum Products)", "Food Articles", "Manufacture of Food Products", "Manufacture of Basic Metals", "Non-Food Articles" and "Manufacture of Chemicals and Chemical Products".
| Month | All commodities | Primary articles | Fuel and power | Manufactured products | WPI food index |
|---|---|---|---|---|---|
| March 2026 | 3.98 | 2.58 | 3.20 | 4.80 | 1.92 |
| April 2026 | 8.36 | 3.96 | 25.00 | 6.68 | 3.29 |
| May 2026 | 9.88 | 5.26 | 30.80 | 7.68 | 4.58 |
| June 2026 | 9.97 | 7.00 | 27.18 | 7.78 | 6.23 |
| July 2026 | 9.78 | 8.52 | 20.05 | 8.29 | 6.65 |
| August 2026 | 9.92 | 7.76 | 22.93 | 8.37 | 7.05 |
Source: OEA, WPI monthly index, base 2022-23 ; OEA, WPI press release of 14 September 2026 .
The items that rose most
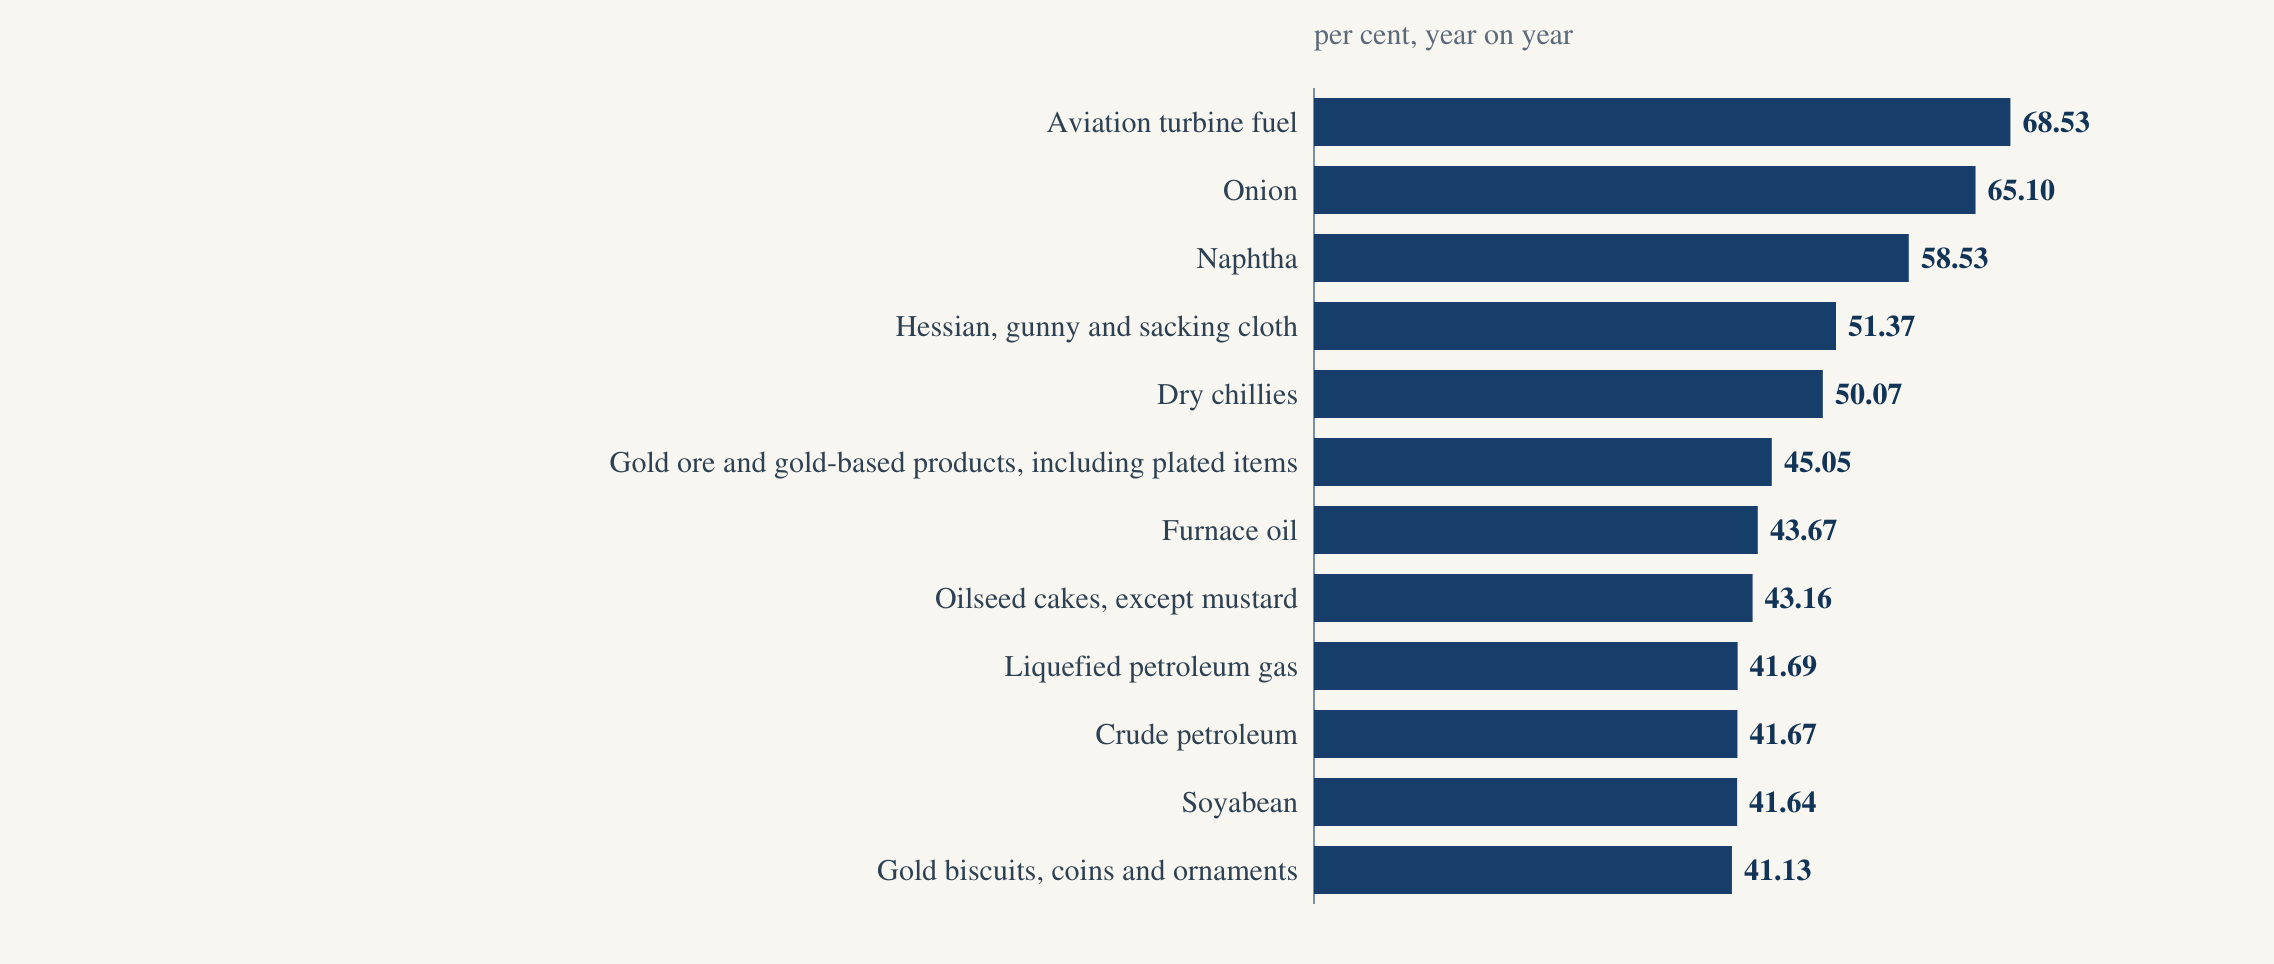
Among the items that carry at least 0.15 per cent of the index, these twelve rose most in the year to August 2026. Aviation turbine fuel rose 68.53 per cent, while onion rose 65.10 per cent.
Source: OEA, WPI monthly index, base 2022-23 . Each observation's dated source is linked in its CSV row.
View the figures in a table
| Observation | Value | Official source |
|---|---|---|
| Aviation turbine fuel | 68.53 | 2026-09-14 |
| Onion | 65.1 | 2026-09-14 |
| Naphtha | 58.53 | 2026-09-14 |
| Hessian, gunny and sacking cloth | 51.37 | 2026-09-14 |
| Dry chillies | 50.07 | 2026-09-14 |
| Gold ore and gold-based products, including plated items | 45.05 | 2026-09-14 |
| Furnace oil | 43.67 | 2026-09-14 |
| Oilseed cakes, except mustard | 43.16 | 2026-09-14 |
| Liquefied petroleum gas | 41.69 | 2026-09-14 |
| Crude petroleum | 41.67 | 2026-09-14 |
| Soyabean | 41.64 | 2026-09-14 |
| Gold biscuits, coins and ornaments | 41.13 | 2026-09-14 |
Nearly two thirds of the basket rose more than 4 per cent
Worked out from the OEA's own item indices and weights, items carrying 64.88 per cent of the weight of all the items the OEA priced in both August 2025 and August 2026 rose more than 4 per cent over that year. In the year to August 2025, the same share was 19.59 per cent.

Source: OEA, WPI monthly index, base 2022-23 . Each observation's dated source is linked in its CSV row.
View the figures in a table
| Observation | Value | Official source |
|---|---|---|
| Year to August 2025 | 19.59 | 2026-09-14 |
| Year to August 2026 | 64.88 | 2026-09-14 |
The first-sale price, a year on
Fuel and power that sold for Rs 1,00,000 at first sale in August 2025, in the same mix as the OEA's fuel and power index, sold for Rs 1,22,930 in August 2026, at the OEA's published rate of 22.93 per cent for that index. Goods in the mix of the whole index that sold for Rs 1,00,000 sold for Rs 1,09,920, at the all-commodities rate of 9.92 per cent, and goods in the mix of the food index sold for Rs 1,07,050, at its rate of 7.05 per cent.
Try your own amount, and the OEA's fuel and power rate is applied to it.
Enter an amount between Rs 0 and Rs 100,000,000.
Sale a year ago x (1 + the fuel and power rate) = the same sale now
On the Government's own index, wholesale inflation went from 1.19 per cent in January 2026 to 9.92 per cent in August, and items carrying nearly two thirds of its weight rose more than 4 per cent in the year to August.
Terms, explained
- Wholesale Price Index
- The Office of the Economic Adviser (OEA), in the Ministry of Commerce and Industry, publishes the Wholesale Price Index each month. Its metadata for the index on the 2022-23 base describes it as "a measure of average change in the wholesale prices of commodities first stage or factory gate transaction". The same metadata says that the OEA tracks the "ex-factory price for manufactured products, ex-mine prices for minerals, ex-storage/ex-bottling price for mineral oils and Agri-market (mandi) price for agricultural commodities", which means the price at the first sale, before goods reach a shop. The rate of inflation is how much higher the index is than in the same month a year before.
- Rate of inflation
- The percentage by which the index is higher than in the same month a year before. A rate of 9.92 per cent means that goods in the index's mix that sold for Rs 100 at first sale a year ago sold for Rs 109.92.
- Major groups
- The index has three major groups. Primary articles, which include food grains, vegetables and minerals, carry 22.76 per cent of its weight. Fuel and power carries 14.11 per cent, while manufactured products carry 63.13 per cent.
- WPI food index
- The OEA's food index joins the food articles in primary articles with the food products in manufactured products. Its weight is 24.99 per cent, as the OEA's release prints it.
- Base year
- The year whose prices are set at 100. The headline series is on the 2022-23 base from April 2024, and it is on the 2011-12 base before that.
- Provisional and final
- The OEA marks the latest two months provisional, and it publishes the final figure for each month two months later.
- A run of rises
- The number of months in a row in which the published rate was higher than in the month before.
Downloads for readers and the press
Sources & method
The OEA publishes the Wholesale Price Index each month, in a press release and in a workbook of monthly indices. This brief reads its release of 14 September 2026, its workbooks on the 2022-23 and 2011-12 bases, and the releases that print the final rates of 2022. To get the rate of inflation, divide the index by the index of twelve months earlier and subtract one. The OEA does this with indices printed to one decimal place, and so does this brief.
The headline series is on the 2022-23 base from April 2024, and on the 2011-12 base before that. The 2011-12 series stops at April 2026. The lowest of the four months, July 2026 at 9.78 per cent, is 1.11 points above the highest month from October 2022 to April 2026 on the headline series, which was October 2022 at 8.67 per cent, and 1.09 points above the highest on the 2011-12 series, which was April 2026 at 8.69 per cent. For the comparison to fail, the 2022-23 series would have to run more than a point above the 2011-12 series, and in the 25 months both series printed a rate, from April 2024 to April 2026, it ran at most 0.06 points above it.
A run of rises counts the months in a row in which the published rate was higher than in the month before. The runs of the food index and of manufactured products lie wholly on the 2022-23 base.
The share of the basket counts the OEA's weight for every item whose index rose more than 4 per cent over the same month a year earlier, and divides it by the weight of all items printed in both months, which is 99.59 of the index's 100. It is this brief's arithmetic on the OEA's item indices and weights.
- OEA, WPI press release of 14 September 2026 .
- OEA, WPI monthly index, base 2022-23 .
- OEA, WPI monthly index, base 2011-12, file of 15 July 2026 .
- OEA, metadata of the WPI and PPIs, base 2022-23 .
- OEA, WPI press release of 16 January 2023 .
- OEA, WPI press release of 14 December 2022 .