Gold loans, a record share
Gold loans stood at ₹5,59,468 crore on 31 August 2026, against ₹3,05,342 crore a year earlier and ₹1,32,647 crore two years earlier. The stock in August 2026 is 4.2 times as large as it was in August 2024.
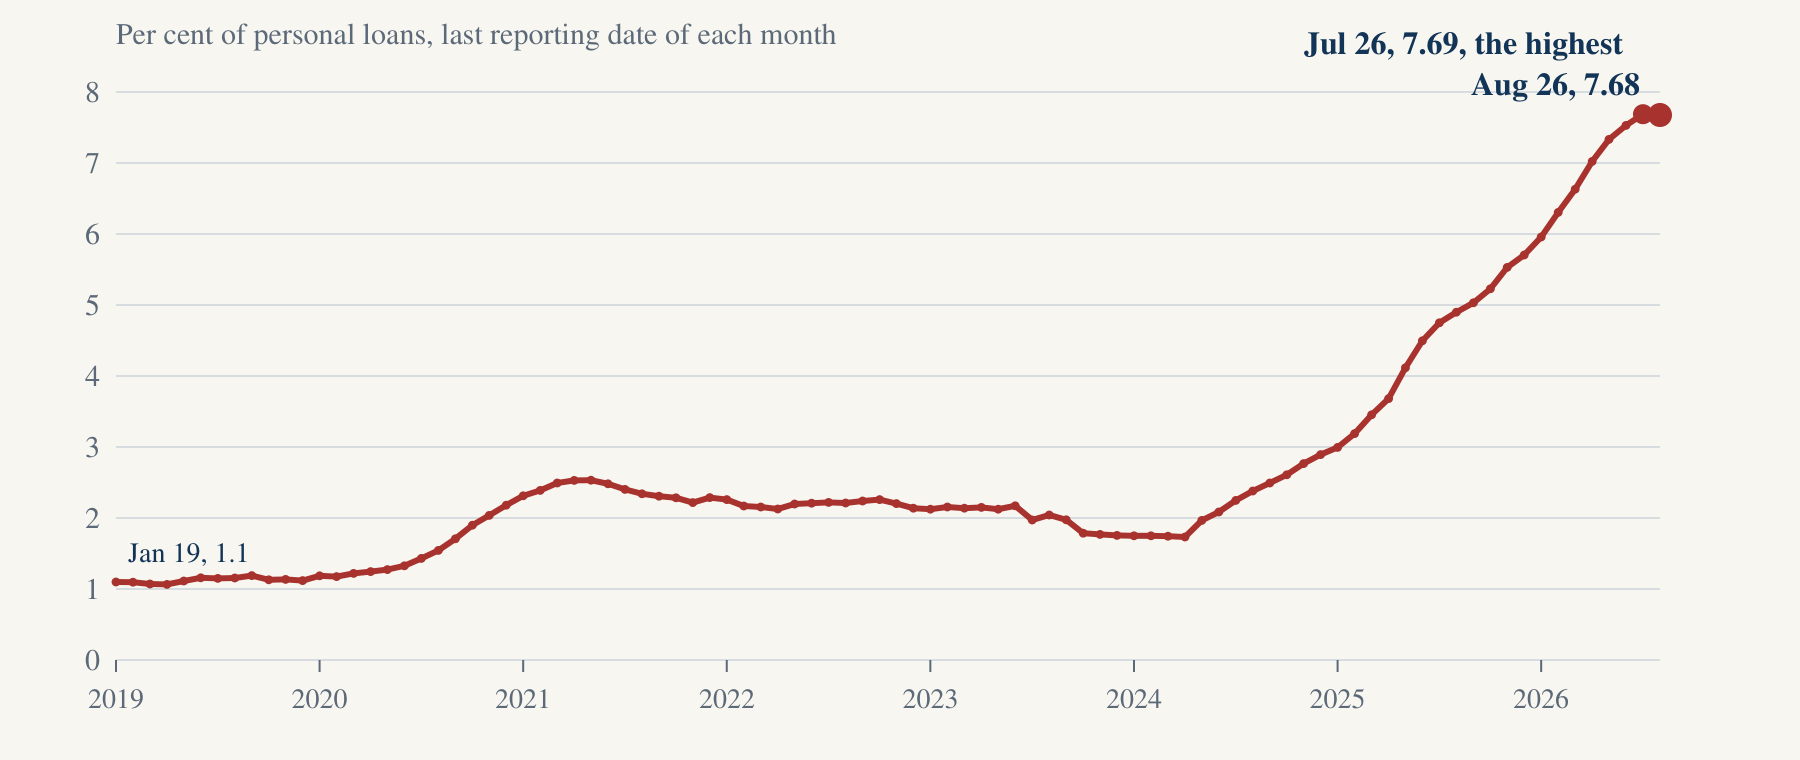
From 2019 to 2023 the share never went above 2.53 per cent, which it reached in May 2021.
Of the 82 lines of non-food credit in the Reserve Bank's two tables, gold loans grew fastest in each month from January to July 2026.
The Reserve Bank's release for September 2026 is expected on 30 October 2026, while the release for September 2025 came on 31 October 2025.
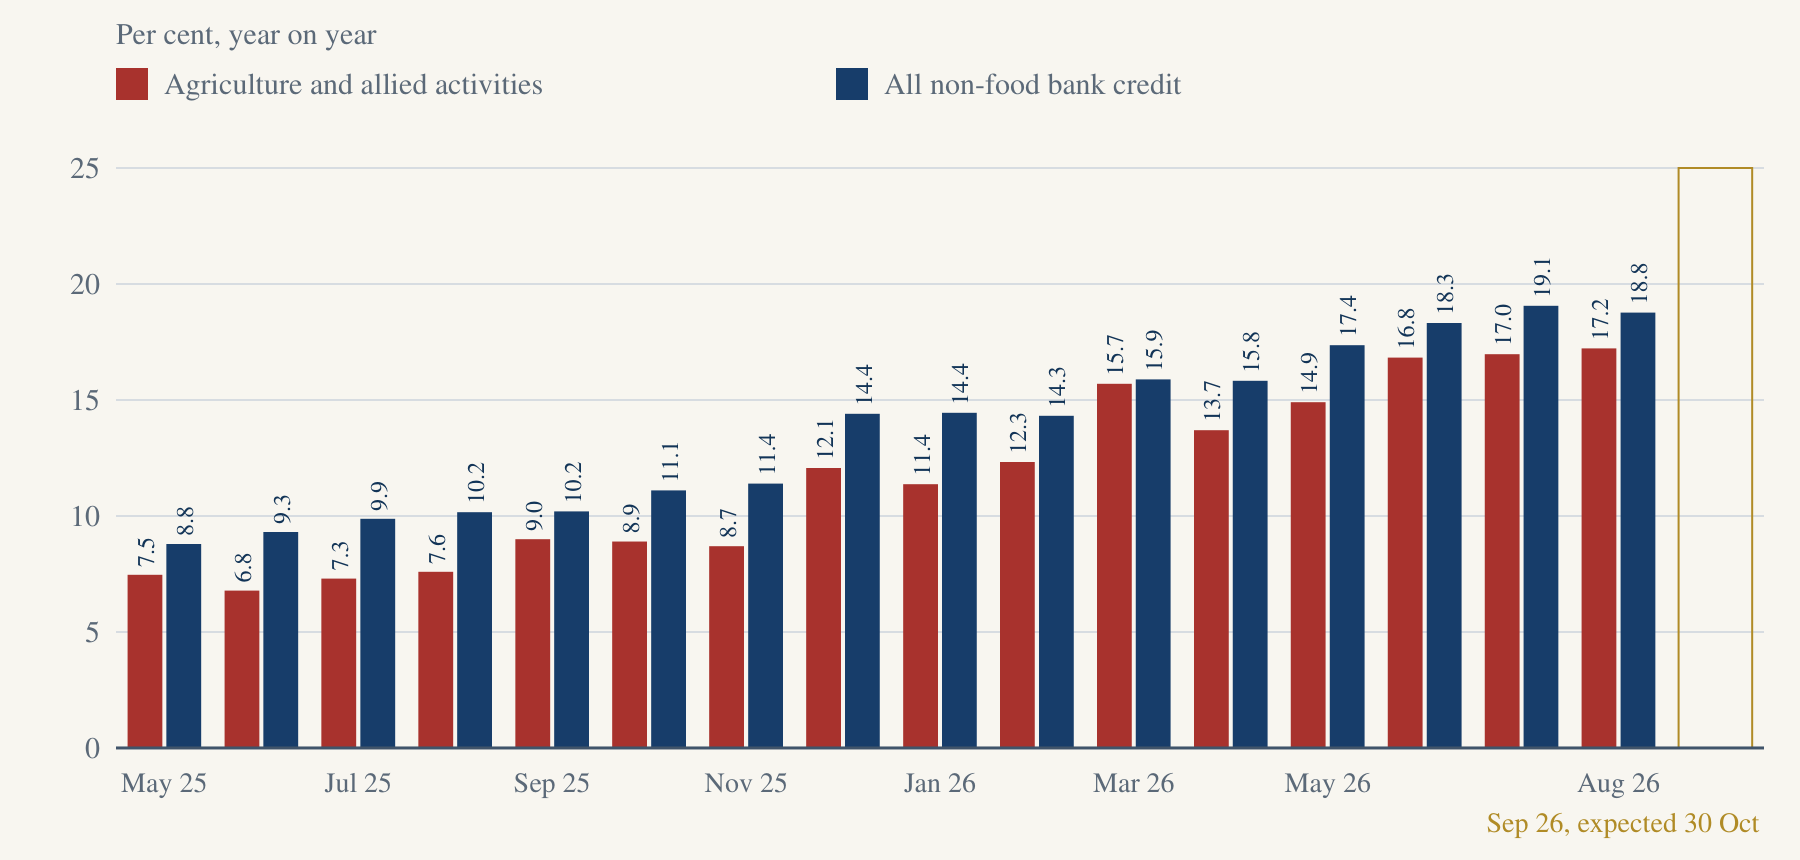
The coming figures will be read against September 2025, when farm credit grew 9.0 per cent and all non-food bank credit grew 10.2 per cent, as the release of 31 October 2025 printed them. If farm credit again grows more slowly in September 2026, the run that covers every one of the 16 months from May 2025 to August 2026 reaches a seventeenth month.
Source: RBI, Sectoral Deployment of Bank Credit, August 2026, Statements 1 and 2 ; RBI, Sectoral Deployment of Bank Credit, July 2026, Statements 1 and 2 ; RBI, Database on Indian Economy, deployment of gross bank credit by major sectors (Bulletin Table 15), January 2019 to December 2025 ; RBI press release, Sectoral Deployment of Bank Credit, September 2025, 31 October 2025 .
The essentials
Loans against gold jewellery reached 7.69 per cent of banks' personal loans on 31 July 2026, the highest share in any month since January 2019, and were 7.68 per cent on 31 August 2026, the second highest. This brief calls them gold loans, and it reads each share as the Reserve Bank reports it. January 2019 is where the Reserve Bank's DBIE table of these figures begins. Gold loans stood at ₹5,59,468 crore on 31 August 2026, which is 83.2 per cent more than a year earlier. From 2019 to 2023 the share never went above 2.53 per cent, which it reached in May 2021. Of the 82 lines of non-food credit in the Reserve Bank's two tables, gold loans grew fastest in each month from January to July 2026.
Source: RBI, Sectoral Deployment of Bank Credit, August 2026, Statements 1 and 2 ; RBI, Database on Indian Economy, deployment of gross bank credit by major sectors (Bulletin Table 15), January 2019 to December 2025 .
Loans against gold, August 2026
Loans against gold jewellery reached 7.69 per cent of banks' personal loans on 31 July 2026, the highest share in any month since January 2019, and were 7.68 per cent on 31 August 2026, the second highest. This brief calls them gold loans, and it reads each share as the Reserve Bank reports it. January 2019 is where the Reserve Bank's DBIE table of these figures begins. Gold loans stood at ₹5,59,468 crore on 31 August 2026, which is 83.2 per cent more than a year earlier.
Source: RBI, Sectoral Deployment of Bank Credit, August 2026, Statements 1 and 2 ; RBI, Database on Indian Economy, deployment of gross bank credit by major sectors (Bulletin Table 15), January 2019 to December 2025 .
The fastest line, January to July 2026
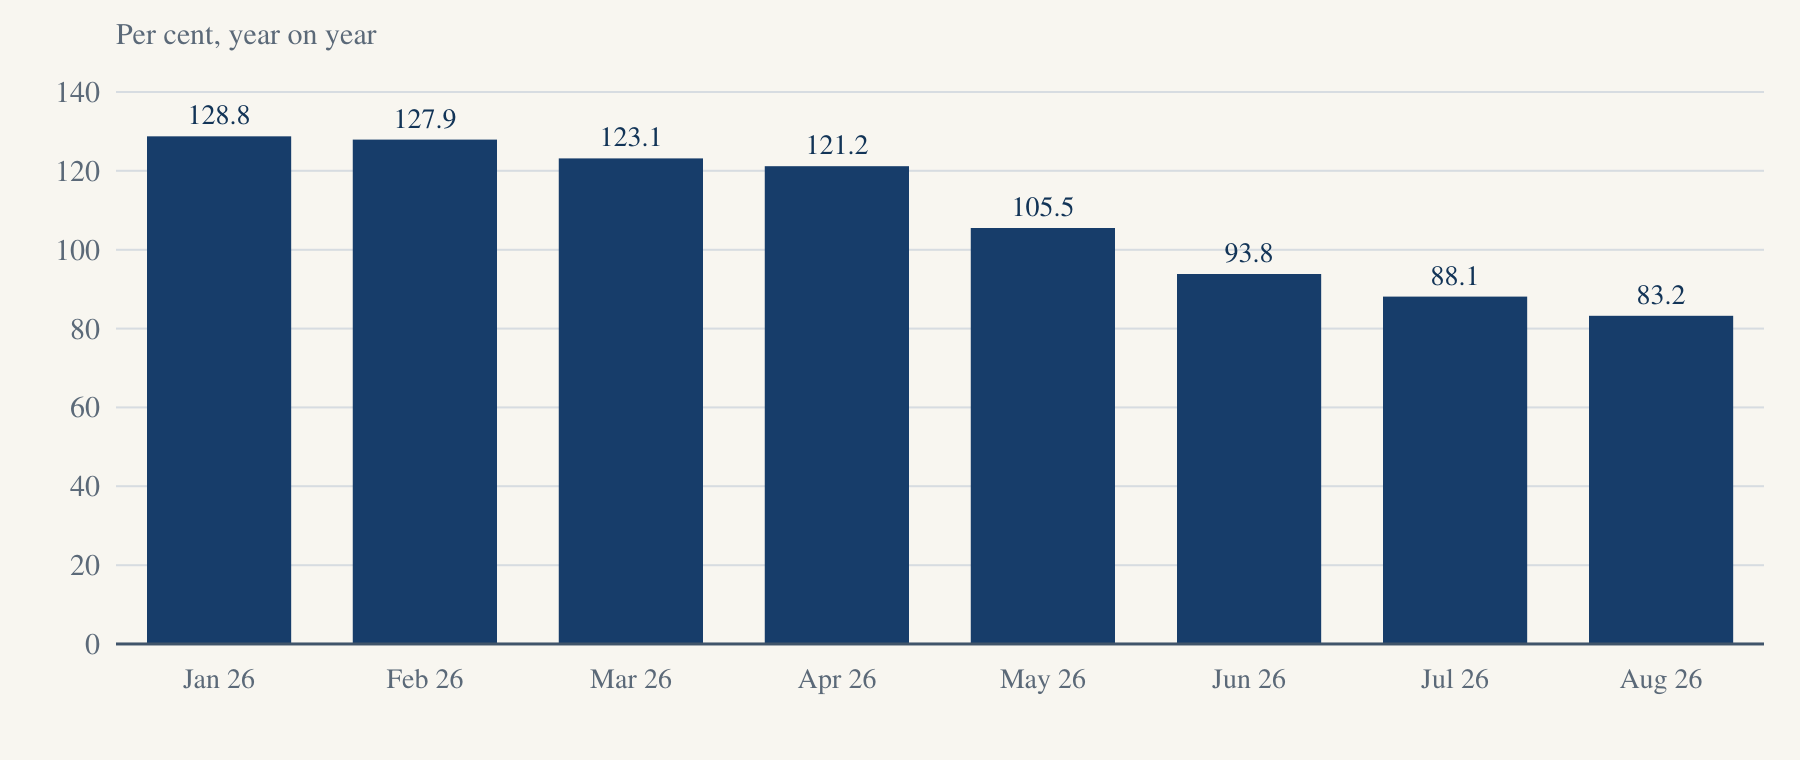
Gold loans grew 128.8 per cent over a year earlier in January 2026, and 88.1 per cent in July 2026. The Reserve Bank's workbooks show that in each of those months they grew faster than any other line of non-food credit.
Source: RBI, Sectoral Deployment of Bank Credit, January 2026, Statements 1 and 2 ; RBI, Sectoral Deployment of Bank Credit, February 2026, Statements 1 and 2 ; RBI, Sectoral Deployment of Bank Credit, March 2026, Statements 1 and 2 ; RBI, Sectoral Deployment of Bank Credit, April 2026, Statements 1 and 2 ; RBI, Sectoral Deployment of Bank Credit, May 2026, Statements 1 and 2 ; RBI, Sectoral Deployment of Bank Credit, June 2026, Statements 1 and 2 ; RBI, Sectoral Deployment of Bank Credit, July 2026, Statements 1 and 2 ; RBI, Sectoral Deployment of Bank Credit, August 2026, Statements 1 and 2 .
Farm credit behind the headline
Bank credit to agriculture and allied activities, which this brief calls farm credit, has grown more slowly than all non-food bank credit in every one of the 16 months from May 2025 to August 2026. In August 2026 farm credit grew 17.2 per cent, while all non-food bank credit grew 18.8 per cent.
Source: RBI press release, Sectoral Deployment of Bank Credit, August 2026, 30 September 2026 ; RBI press release, Sectoral Deployment of Bank Credit, May 2025, 30 June 2025 ; RBI press release, Sectoral Deployment of Bank Credit, June 2025, 31 July 2025 ; RBI press release, Sectoral Deployment of Bank Credit, July 2025, 29 August 2025 ; RBI press release, Sectoral Deployment of Bank Credit, August 2025, 30 September 2025 ; RBI press release, Sectoral Deployment of Bank Credit, September 2025, 31 October 2025 ; RBI press release, Sectoral Deployment of Bank Credit, October 2025, 28 November 2025 ; RBI press release, Sectoral Deployment of Bank Credit, November 2025, 31 December 2025 ; RBI press release, Sectoral Deployment of Bank Credit, April 2026, 29 May 2026 ; RBI press release, Sectoral Deployment of Bank Credit, May 2026, 30 June 2026 ; RBI press release, Sectoral Deployment of Bank Credit, June 2026, 31 July 2026 ; RBI press release, Sectoral Deployment of Bank Credit, July 2026, 31 August 2026 ; RBI press release, Sectoral Deployment of Bank Credit, August 2026, 30 September 2026 ; RBI, Sectoral Deployment of Bank Credit, August 2026, Statements 1 and 2 ; RBI, Database on Indian Economy, deployment of gross bank credit by major sectors (Bulletin Table 15), January 2019 to December 2025 .
The weaker sections
The Reserve Bank reports a line of the priority sector, which its workbooks label "Weaker Sections including net PSLC- SF/MF". The Reserve Bank's line for the weaker sections, which includes net priority sector lending certificates, grew more slowly than all non-food bank credit in each month from January to August 2026, eight months in a row, as the workbooks show. The widest gap came in May 2026, when the line grew 9.1 per cent and all non-food bank credit grew 17.4 per cent.
Source: RBI, Sectoral Deployment of Bank Credit, January 2026, Statements 1 and 2 ; RBI, Sectoral Deployment of Bank Credit, February 2026, Statements 1 and 2 ; RBI, Sectoral Deployment of Bank Credit, March 2026, Statements 1 and 2 ; RBI, Sectoral Deployment of Bank Credit, April 2026, Statements 1 and 2 ; RBI, Sectoral Deployment of Bank Credit, May 2026, Statements 1 and 2 ; RBI, Sectoral Deployment of Bank Credit, June 2026, Statements 1 and 2 ; RBI, Sectoral Deployment of Bank Credit, July 2026, Statements 1 and 2 ; RBI, Sectoral Deployment of Bank Credit, August 2026, Statements 1 and 2 .
The smallest loans
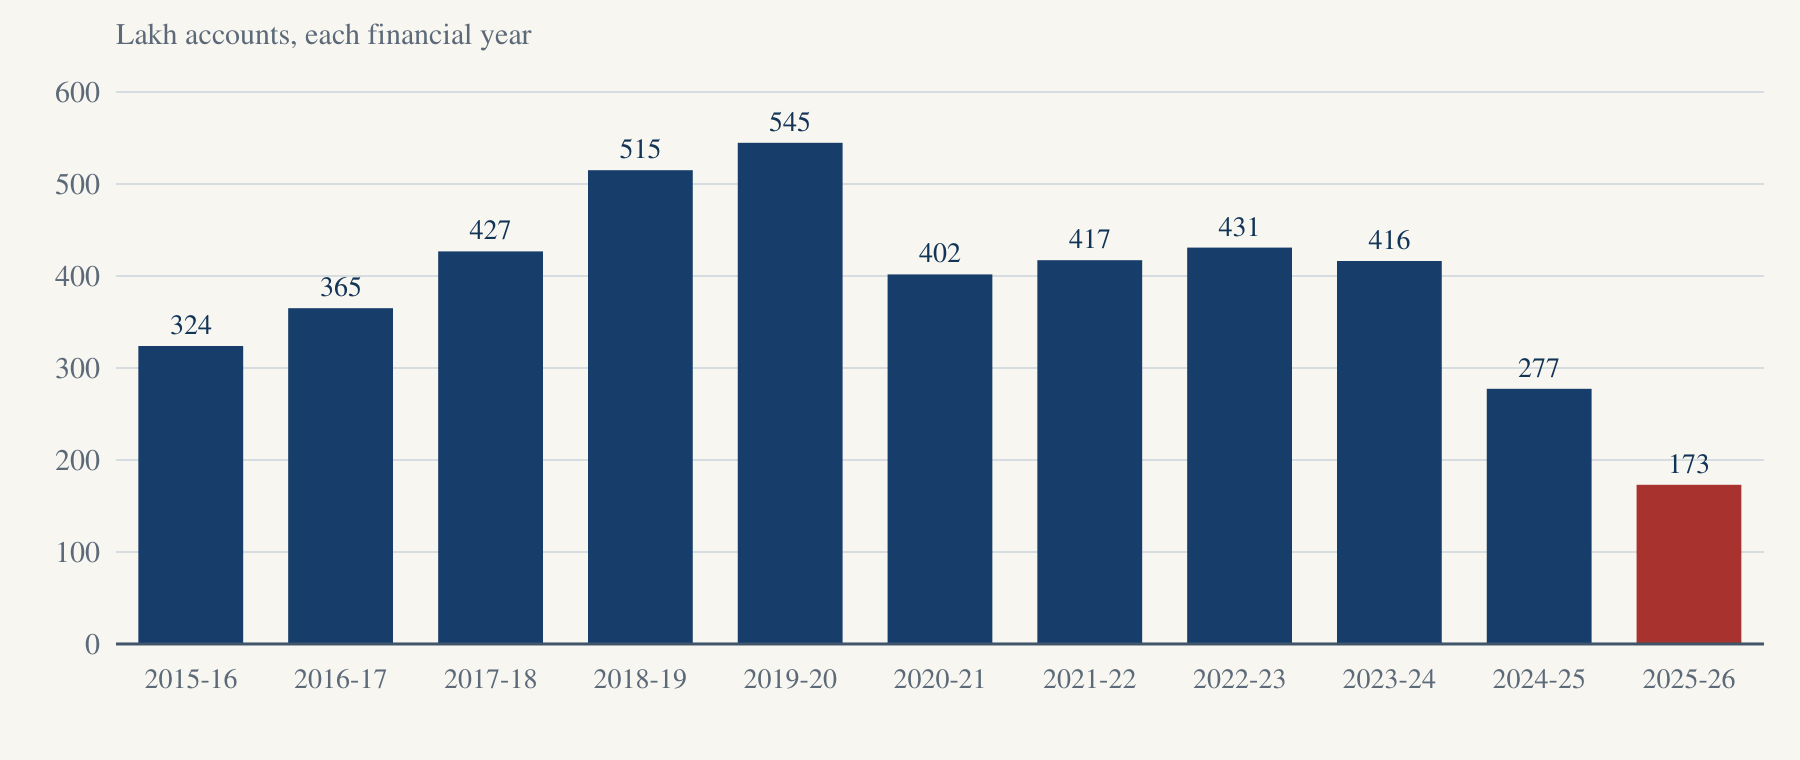
Lenders reported 1,72,97,817 Shishu loan accounts under the Pradhan Mantri MUDRA Yojana (PMMY) in 2025-26, which is the fewest since the scheme began in 2015-16. That is 68.2 per cent fewer than the 5,44,80,992 accounts of 2019-20, when the count was highest. It is also 37.6 per cent fewer than the 2,77,41,792 accounts of 2024-25, the year before.
Source: MUDRA, PMMY Overall Performance, 2015-16 ; MUDRA, PMMY Overall Performance, 2016-17 ; MUDRA, PMMY Overall Performance, 2017-18 ; MUDRA, PMMY Overall Performance, 2018-19 ; MUDRA, PMMY Overall Performance, 2019-20 ; MUDRA, PMMY Overall Performance, 2020-21 ; MUDRA, PMMY Overall Performance, 2021-22 ; MUDRA, PMMY Overall Performance, 2022-23 ; MUDRA, PMMY Overall Performance, 2023-24 ; MUDRA, PMMY Overall Performance, 2024-25 ; MUDRA, PMMY Overall Performance, 2025-26 .
The fastest-growing line, January to July 2026
Gold loans grew 128.8 per cent over a year earlier in January 2026, and 88.1 per cent in July 2026. The Reserve Bank's workbooks show that in each of those months they grew faster than any other line of non-food credit. In August 2026, which is the latest month that the Reserve Bank has published, gold loans grew 83.2 per cent.
Source: RBI, Sectoral Deployment of Bank Credit, January 2026, Statements 1 and 2 ; RBI, Sectoral Deployment of Bank Credit, February 2026, Statements 1 and 2 ; RBI, Sectoral Deployment of Bank Credit, March 2026, Statements 1 and 2 ; RBI, Sectoral Deployment of Bank Credit, April 2026, Statements 1 and 2 ; RBI, Sectoral Deployment of Bank Credit, May 2026, Statements 1 and 2 ; RBI, Sectoral Deployment of Bank Credit, June 2026, Statements 1 and 2 ; RBI, Sectoral Deployment of Bank Credit, July 2026, Statements 1 and 2 ; RBI, Sectoral Deployment of Bank Credit, August 2026, Statements 1 and 2 . Each observation's dated source is linked in its CSV row.
View the figures in a table
| Observation | Value | Official source |
|---|---|---|
| Jan 26 | 128.8 | RBI, Sectoral Deployment of Bank Credit, January 2026, Statements 1 and 2 |
| Feb 26 | 127.9 | RBI, Sectoral Deployment of Bank Credit, February 2026, Statements 1 and 2 |
| Mar 26 | 123.1 | RBI, Sectoral Deployment of Bank Credit, March 2026, Statements 1 and 2 |
| Apr 26 | 121.2 | RBI, Sectoral Deployment of Bank Credit, April 2026, Statements 1 and 2 |
| May 26 | 105.5 | RBI, Sectoral Deployment of Bank Credit, May 2026, Statements 1 and 2 |
| Jun 26 | 93.8 | RBI, Sectoral Deployment of Bank Credit, June 2026, Statements 1 and 2 |
| Jul 26 | 88.1 | RBI, Sectoral Deployment of Bank Credit, July 2026, Statements 1 and 2 |
| Aug 26 | 83.2 | RBI, Sectoral Deployment of Bank Credit, August 2026, Statements 1 and 2 |
Farm credit behind the headline
Bank credit to agriculture and allied activities, which this brief calls farm credit, has grown more slowly than all non-food bank credit in every one of the 16 months from May 2025 to August 2026. In August 2026 farm credit grew 17.2 per cent, while all non-food bank credit grew 18.8 per cent.
Source: RBI press release, Sectoral Deployment of Bank Credit, August 2026, 30 September 2026 ; RBI press release, Sectoral Deployment of Bank Credit, May 2025, 30 June 2025 ; RBI press release, Sectoral Deployment of Bank Credit, June 2025, 31 July 2025 ; RBI press release, Sectoral Deployment of Bank Credit, July 2025, 29 August 2025 ; RBI press release, Sectoral Deployment of Bank Credit, August 2025, 30 September 2025 ; RBI press release, Sectoral Deployment of Bank Credit, September 2025, 31 October 2025 ; RBI press release, Sectoral Deployment of Bank Credit, October 2025, 28 November 2025 ; RBI press release, Sectoral Deployment of Bank Credit, November 2025, 31 December 2025 ; RBI press release, Sectoral Deployment of Bank Credit, April 2026, 29 May 2026 ; RBI press release, Sectoral Deployment of Bank Credit, May 2026, 30 June 2026 ; RBI press release, Sectoral Deployment of Bank Credit, June 2026, 31 July 2026 ; RBI press release, Sectoral Deployment of Bank Credit, July 2026, 31 August 2026 ; RBI press release, Sectoral Deployment of Bank Credit, August 2026, 30 September 2026 ; RBI, Sectoral Deployment of Bank Credit, August 2026, Statements 1 and 2 ; RBI, Database on Indian Economy, deployment of gross bank credit by major sectors (Bulletin Table 15), January 2019 to December 2025 . Each observation's dated source is linked in its CSV row.
View the figures in a table
The weaker sections
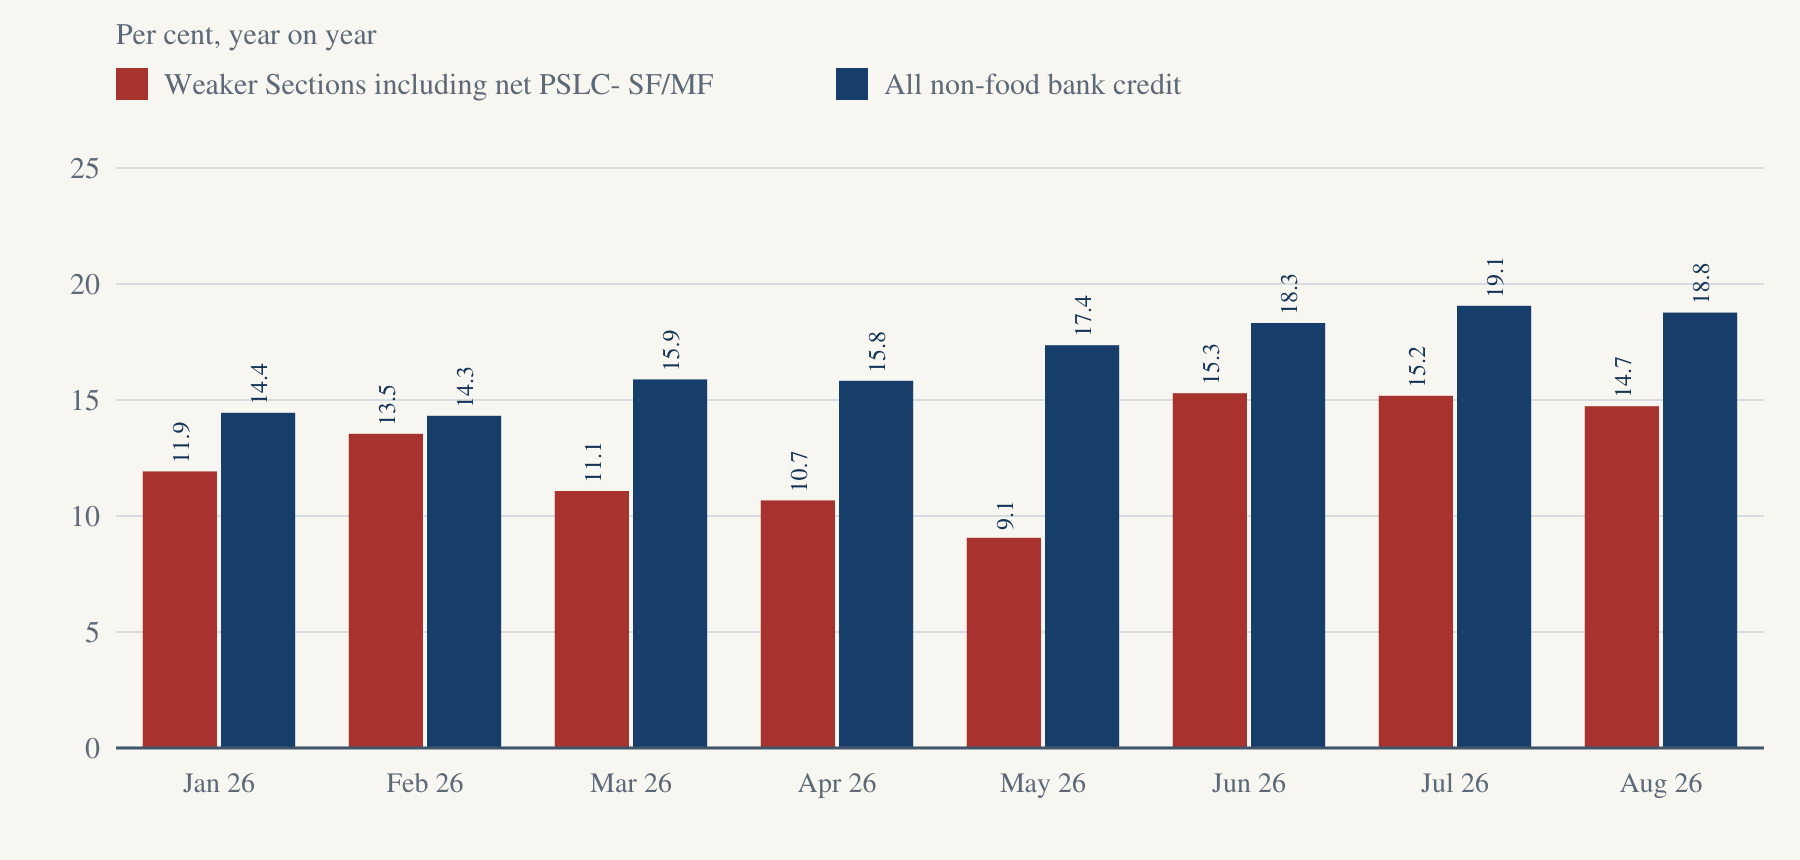
The Reserve Bank reports a line of the priority sector, which its workbooks label "Weaker Sections including net PSLC- SF/MF". The Reserve Bank's line for the weaker sections, which includes net priority sector lending certificates, grew more slowly than all non-food bank credit in each month from January to August 2026, eight months in a row, as the workbooks show. The widest gap came in May 2026, when the line grew 9.1 per cent and all non-food bank credit grew 17.4 per cent.
Source: RBI, Sectoral Deployment of Bank Credit, January 2026, Statements 1 and 2 ; RBI, Sectoral Deployment of Bank Credit, February 2026, Statements 1 and 2 ; RBI, Sectoral Deployment of Bank Credit, March 2026, Statements 1 and 2 ; RBI, Sectoral Deployment of Bank Credit, April 2026, Statements 1 and 2 ; RBI, Sectoral Deployment of Bank Credit, May 2026, Statements 1 and 2 ; RBI, Sectoral Deployment of Bank Credit, June 2026, Statements 1 and 2 ; RBI, Sectoral Deployment of Bank Credit, July 2026, Statements 1 and 2 ; RBI, Sectoral Deployment of Bank Credit, August 2026, Statements 1 and 2 . Each observation's dated source is linked in its CSV row.
View the figures in a table
Export credit that counts towards the priority sector was lower than a year earlier in each month from January to August 2026. It was 17.2 per cent lower in January, and 9.7 per cent lower in August 2026.
The smallest loans
Lenders reported 1,72,97,817 Shishu loan accounts under the Pradhan Mantri MUDRA Yojana (PMMY) in 2025-26, which is the fewest since the scheme began in 2015-16. That is 68.2 per cent fewer than the 5,44,80,992 accounts of 2019-20, when the count was highest. It is also 37.6 per cent fewer than the 2,77,41,792 accounts of 2024-25, the year before.
Source: MUDRA, PMMY Overall Performance, 2015-16 ; MUDRA, PMMY Overall Performance, 2016-17 ; MUDRA, PMMY Overall Performance, 2017-18 ; MUDRA, PMMY Overall Performance, 2018-19 ; MUDRA, PMMY Overall Performance, 2019-20 ; MUDRA, PMMY Overall Performance, 2020-21 ; MUDRA, PMMY Overall Performance, 2021-22 ; MUDRA, PMMY Overall Performance, 2022-23 ; MUDRA, PMMY Overall Performance, 2023-24 ; MUDRA, PMMY Overall Performance, 2024-25 ; MUDRA, PMMY Overall Performance, 2025-26 ; MUDRA, home page, as saved on 18 September 2026 . Each observation's dated source is linked in its CSV row.
View the figures in a table
| Observation | Value | Official source |
|---|---|---|
| 2015-16 | 324 | MUDRA, PMMY Overall Performance, 2015-16 |
| 2016-17 | 365 | MUDRA, PMMY Overall Performance, 2016-17 |
| 2017-18 | 427 | MUDRA, PMMY Overall Performance, 2017-18 |
| 2018-19 | 515 | MUDRA, PMMY Overall Performance, 2018-19 |
| 2019-20 | 545 | MUDRA, PMMY Overall Performance, 2019-20 |
| 2020-21 | 402 | MUDRA, PMMY Overall Performance, 2020-21 |
| 2021-22 | 417 | MUDRA, PMMY Overall Performance, 2021-22 |
| 2022-23 | 431 | MUDRA, PMMY Overall Performance, 2022-23 |
| 2023-24 | 416 | MUDRA, PMMY Overall Performance, 2023-24 |
| 2024-25 | 277 | MUDRA, PMMY Overall Performance, 2024-25 |
| 2025-26 | 173 | MUDRA, PMMY Overall Performance, 2025-26 |
MUDRA's own page describes Shishu as "Covering loans upto 50,000/-", which makes it the smallest of the scheme's four kinds of loan.
Business entities that owe the least
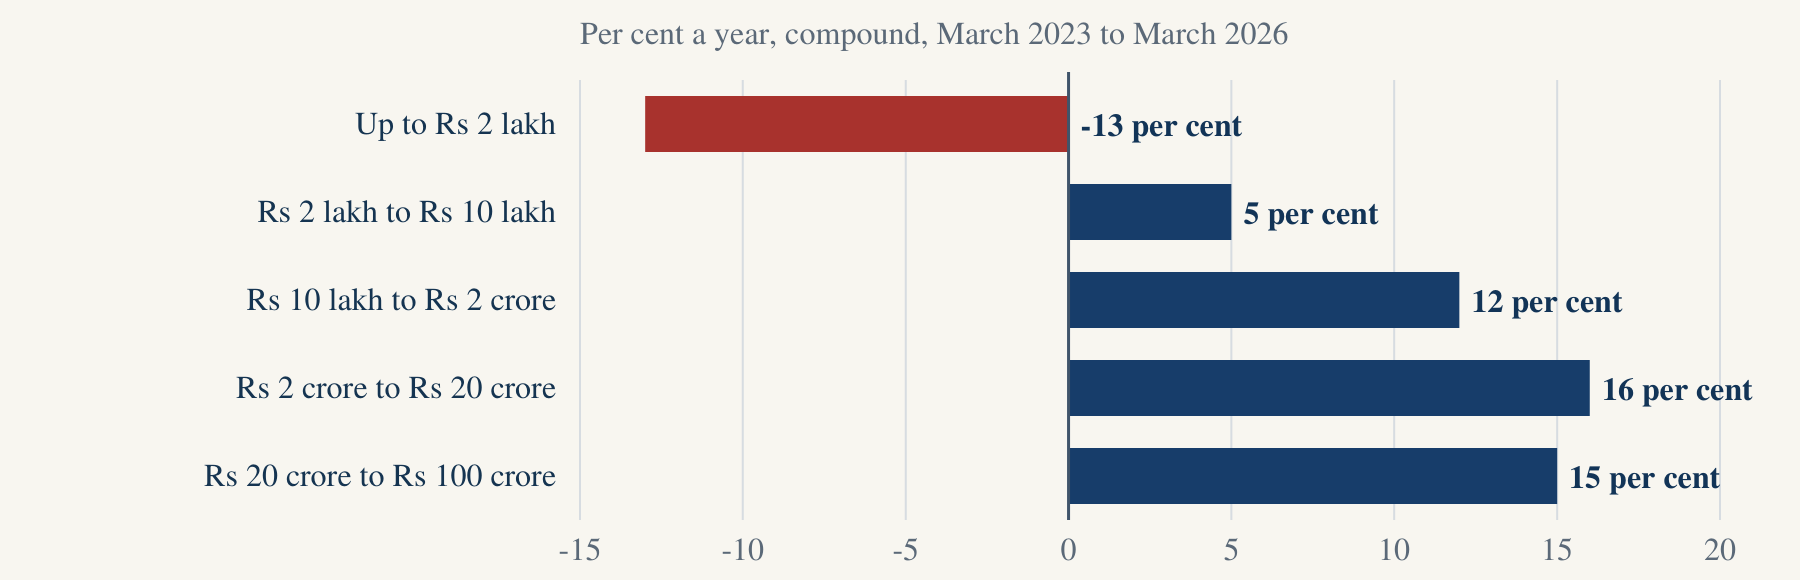
TransUnion CIBIL and SIDBI, the Small Industries Development Bank of India, publish a joint report that tracks what business borrowers owe. For business entities whose total borrowing was up to Rs 2 lakh, balances fell by 13 per cent a year from March 2023 to March 2026. For entities that owed Rs 2 lakh to Rs 10 lakh, balances grew 5 per cent a year, while the next two bands grew 12 and 16 per cent. The figures for January to March 2026 are provisional, as the report says.
Source: TransUnion CIBIL and SIDBI, MSME Pulse, July 2026 . Each observation's dated source is linked in its CSV row.
View the figures in a table
| Observation | Value | Official source |
|---|---|---|
| Up to Rs 2 lakh | -13 | TransUnion CIBIL and SIDBI, MSME Pulse, July 2026 |
| Rs 2 lakh to Rs 10 lakh | 5 | TransUnion CIBIL and SIDBI, MSME Pulse, July 2026 |
| Rs 10 lakh to Rs 2 crore | 12 | TransUnion CIBIL and SIDBI, MSME Pulse, July 2026 |
| Rs 2 crore to Rs 20 crore | 16 | TransUnion CIBIL and SIDBI, MSME Pulse, July 2026 |
| Rs 20 crore to Rs 100 crore | 15 | TransUnion CIBIL and SIDBI, MSME Pulse, July 2026 |
Farm credit, month by month
Bank credit to agriculture and allied activities, which this brief calls farm credit, has grown more slowly than all non-food bank credit in every one of the 16 months from May 2025 to August 2026. In August 2026 farm credit grew 17.2 per cent, while all non-food bank credit grew 18.8 per cent.
Each month shows how fast farm credit grew over a year earlier, and how fast all non-food bank credit grew, as the Reserve Bank prints both.
The coming figures will be read against September 2025, when farm credit grew 9.0 per cent and all non-food bank credit grew 10.2 per cent, as the release of 31 October 2025 printed them.
On the Reserve Bank's own figures, gold loans reached 7.69 per cent of personal loans on 31 July 2026, which is the highest since January 2019, and they were 7.68 per cent on 31 August 2026. Farm credit grew more slowly than all non-food bank credit, and it did so in every one of the 16 months from May 2025 to August 2026.
Terms, explained
- Sectoral deployment of bank credit
- The Reserve Bank's monthly release on how much banks have lent to each sector, such as farming, industry, services and personal loans.
- Gold loans
- This brief's short name for the line that the Reserve Bank calls loans against gold jewellery, which sits within personal loans.
- Farm credit
- This brief's short name for the line that the Reserve Bank calls agriculture and allied activities.
- Non-food bank credit
- All bank credit except the credit given for buying food grains, which the Reserve Bank reports for every scheduled commercial bank.
- Weaker sections
- A part of the priority sector that the Reserve Bank reports each month. Its table labels the line "Weaker Sections including net PSLC- SF/MF", under "Priority Sector (Memo)".
- Shishu
- The smallest of the four kinds of loan under the Pradhan Mantri MUDRA Yojana, which MUDRA describes as covering loans up to Rs 50,000.
Downloads for readers and the press
Sources & method
Every figure on bank credit in this brief comes from the Reserve Bank of India. Each month the Reserve Bank publishes a release and a workbook, "Sectoral Deployment of Bank Credit", which show how much banks have lent to each sector.
In 2026 the sector figures come from a return filed by 41 select banks, which together hold about 95 per cent of the non-food credit of all scheduled commercial banks.
The figure for all non-food bank credit comes from a second return, which covers every scheduled commercial bank. The Reserve Bank marks these data provisional and prints the two rates side by side in each release, as this brief does.
A growth rate here compares a month's outstanding credit with the same month a year earlier. The rates for 2026 are the Reserve Bank's own, printed in its workbooks and releases. This brief works out December 2025 from the Reserve Bank's DBIE table of the Bulletin, because its release for that month is not saved here.
This brief works out the share of loans against gold jewellery from two lines of the same table on the same date: loans against gold jewellery, and all personal loans. The monthly series runs from January 2019 in the Reserve Bank's DBIE table, and from January 2026 in its monthly workbooks. The two sources agree on every date they share. The panel of reporting banks has changed since 2019, so each month's share comes from the panel of that month.
The figures on Shishu loans are MUDRA's own, from its Overall Performance table for each financial year. They count loan accounts and not distinct people. The figures on balances by size of borrower are those of TransUnion CIBIL and SIDBI.
- RBI, Sectoral Deployment of Bank Credit, August 2026, Statements 1 and 2 .
- RBI, Database on Indian Economy, deployment of gross bank credit by major sectors (Bulletin Table 15), January 2019 to December 2025 .
- RBI press release, Sectoral Deployment of Bank Credit, August 2026, 30 September 2026 .
- RBI press release, Sectoral Deployment of Bank Credit, May 2025, 30 June 2025 .
- RBI press release, Sectoral Deployment of Bank Credit, June 2025, 31 July 2025 .
- RBI press release, Sectoral Deployment of Bank Credit, July 2025, 29 August 2025 .
- RBI press release, Sectoral Deployment of Bank Credit, August 2025, 30 September 2025 .
- RBI press release, Sectoral Deployment of Bank Credit, September 2025, 31 October 2025 .
- RBI press release, Sectoral Deployment of Bank Credit, October 2025, 28 November 2025 .
- RBI press release, Sectoral Deployment of Bank Credit, November 2025, 31 December 2025 .
- RBI press release, Sectoral Deployment of Bank Credit, April 2026, 29 May 2026 .
- RBI press release, Sectoral Deployment of Bank Credit, May 2026, 30 June 2026 .
- RBI press release, Sectoral Deployment of Bank Credit, June 2026, 31 July 2026 .
- RBI press release, Sectoral Deployment of Bank Credit, July 2026, 31 August 2026 .
- RBI, Sectoral Deployment of Bank Credit, January 2026, Statements 1 and 2 .
- RBI, Sectoral Deployment of Bank Credit, February 2026, Statements 1 and 2 .
- RBI, Sectoral Deployment of Bank Credit, March 2026, Statements 1 and 2 .
- RBI, Sectoral Deployment of Bank Credit, April 2026, Statements 1 and 2 .
- RBI, Sectoral Deployment of Bank Credit, May 2026, Statements 1 and 2 .
- RBI, Sectoral Deployment of Bank Credit, June 2026, Statements 1 and 2 .
- RBI, Sectoral Deployment of Bank Credit, July 2026, Statements 1 and 2 .
- MUDRA, PMMY Overall Performance, 2015-16 .
- MUDRA, PMMY Overall Performance, 2016-17 .
- MUDRA, PMMY Overall Performance, 2017-18 .
- MUDRA, PMMY Overall Performance, 2018-19 .
- MUDRA, PMMY Overall Performance, 2019-20 .
- MUDRA, PMMY Overall Performance, 2020-21 .
- MUDRA, PMMY Overall Performance, 2021-22 .
- MUDRA, PMMY Overall Performance, 2022-23 .
- MUDRA, PMMY Overall Performance, 2023-24 .
- MUDRA, PMMY Overall Performance, 2024-25 .
- MUDRA, PMMY Overall Performance, 2025-26 .
- MUDRA, home page, as saved on 18 September 2026 .
- TransUnion CIBIL and SIDBI, MSME Pulse, July 2026 .