What the Central Electricity Authority's own reports show
This brief sets each month's electricity against the same month a year earlier, from April 2024 to September 2026. It also sets out what the coming releases will be read against.
- Fossil generation above a year earlier, six months in a row
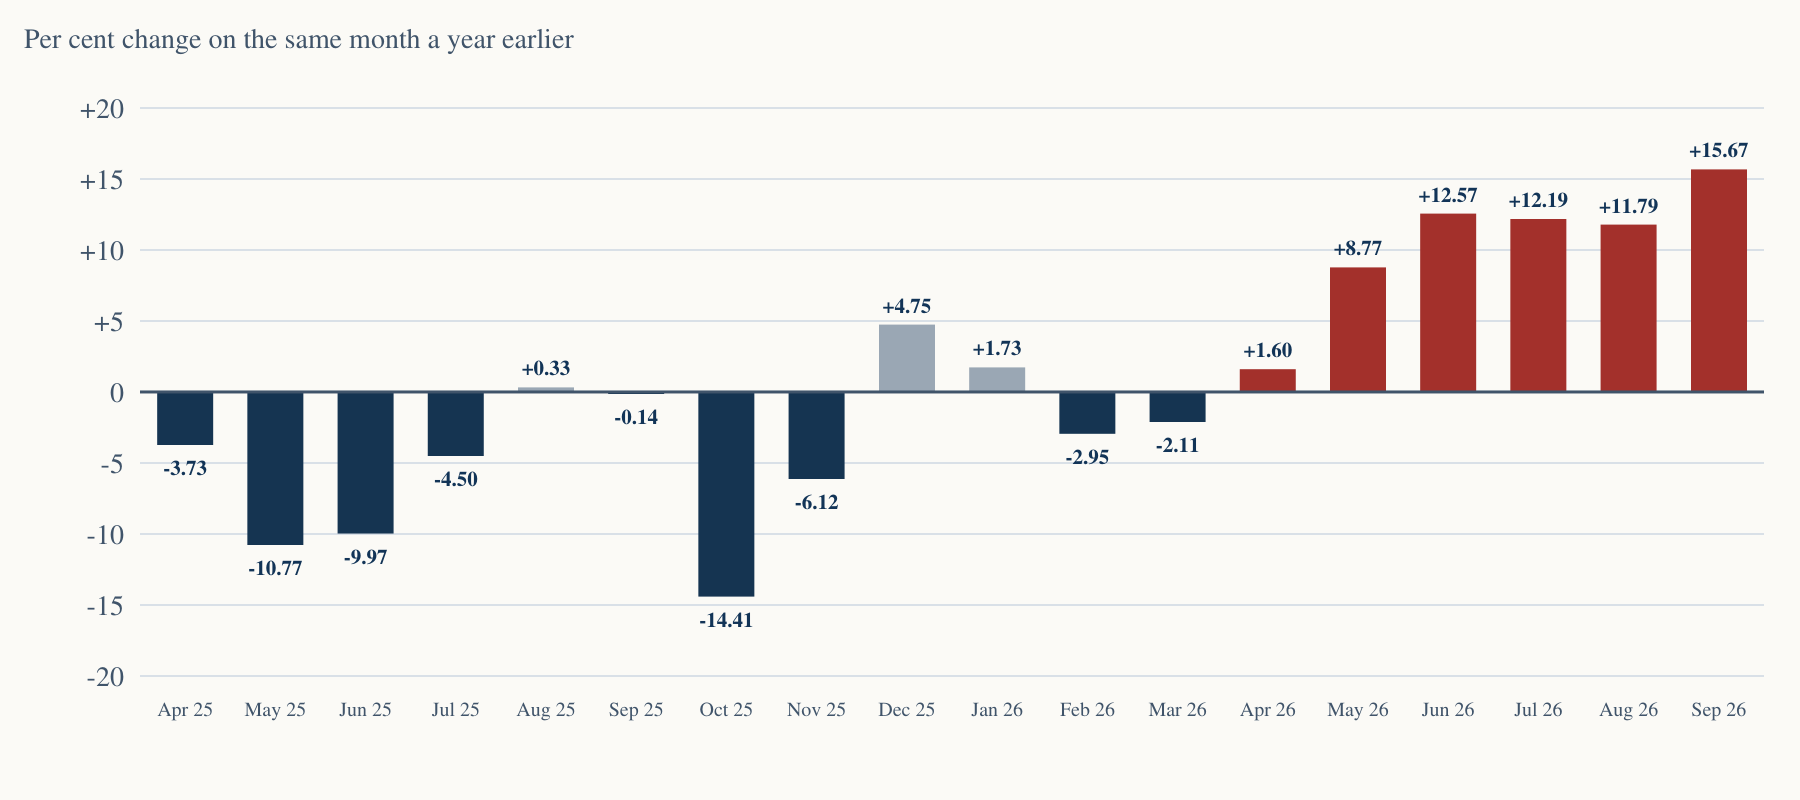
- Fossil-fuel generation was higher than a year earlier in each of six months. That run covers April to September 2026. In September it was 15.67 per cent higher.
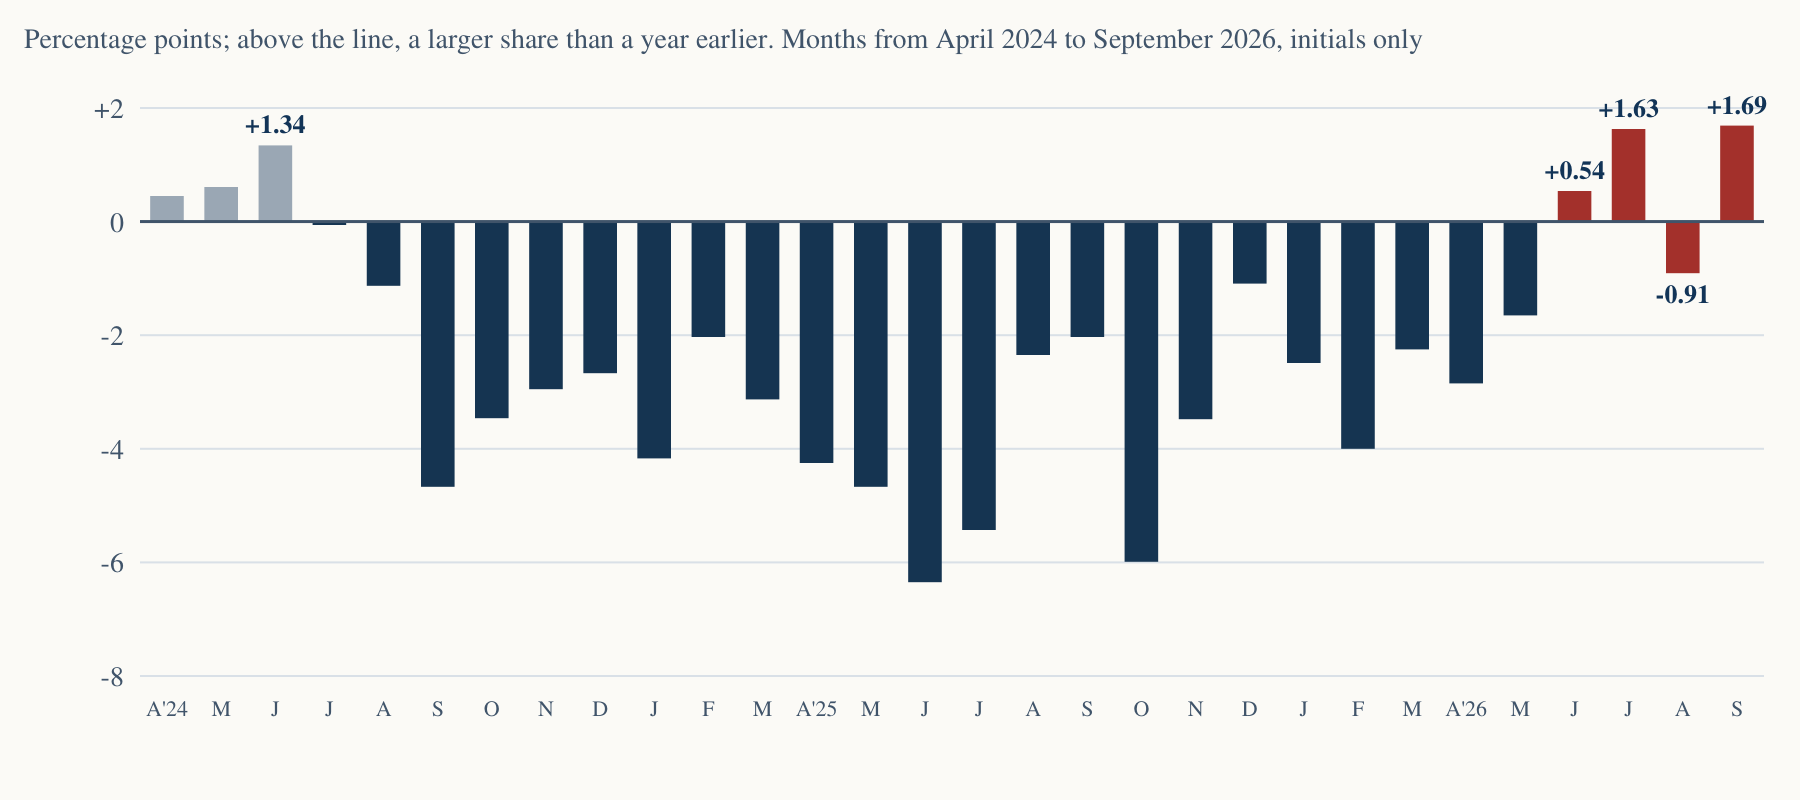
- Share above a year earlier in June, July and September
- The fossil share here leaves out the import from Bhutan. In June 2026 it stood 0.54 percentage points above June 2025. In July it stood 1.63 percentage points above, and in September 1.69 percentage points above.
- Most of the extra power came from fossil fuels
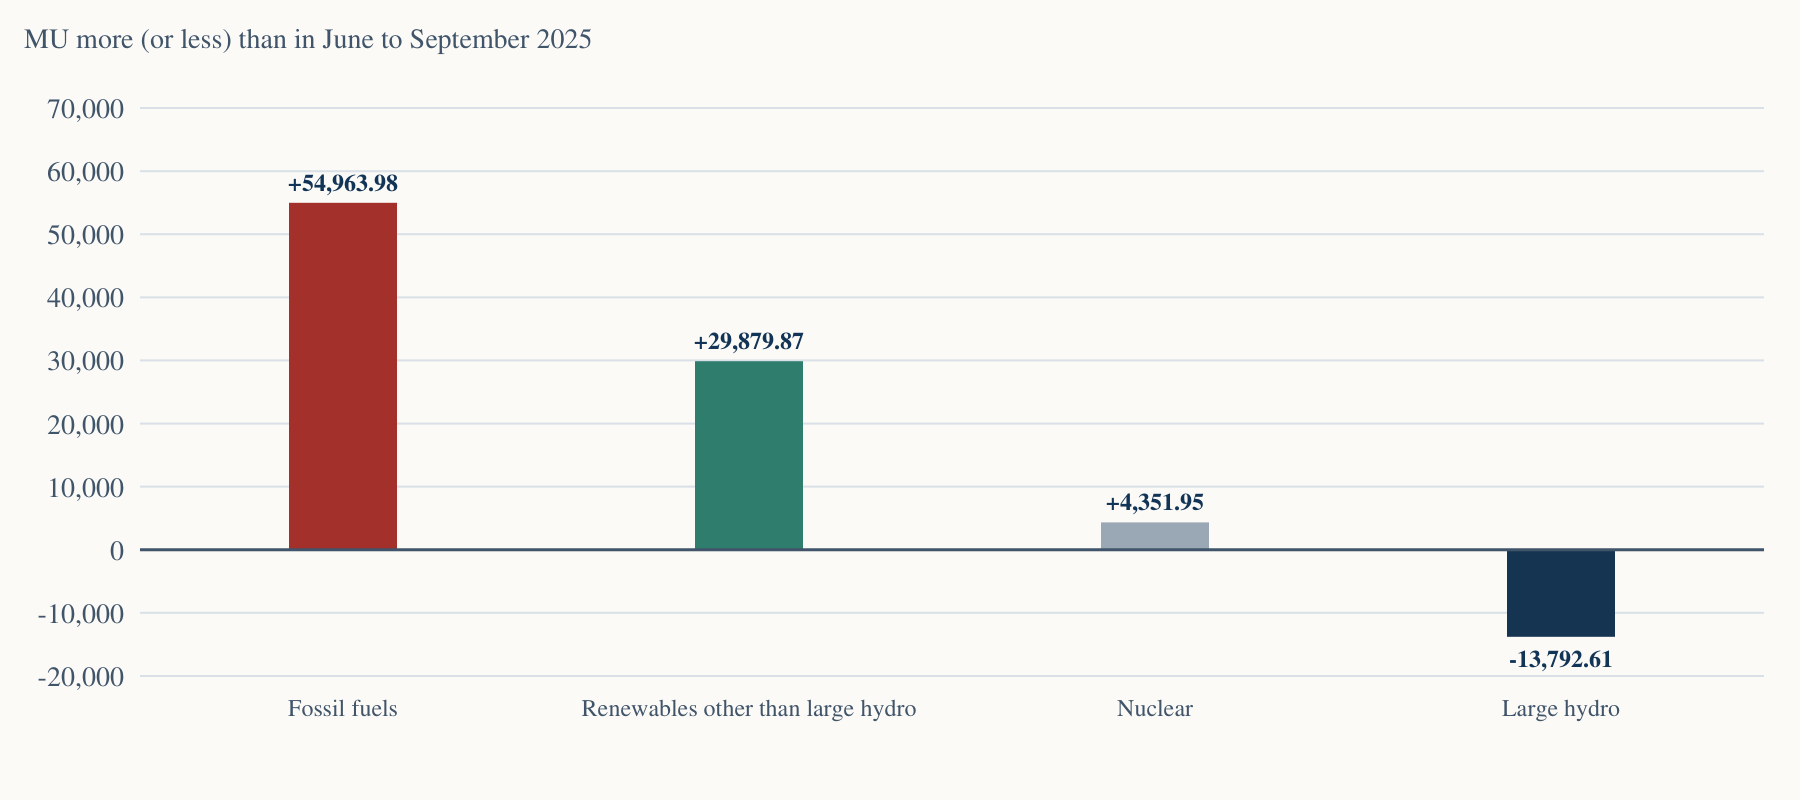
- From June to September 2026, CEA's monthly reports count more electricity. That is more than in the same months a year earlier. The increase is 75,403.19 MU, and the count leaves out the import from Bhutan. Fossil-fuel stations generated 54,963.98 MU of it. That is 72.89 per cent of the extra electricity in CEA's monthly reports. A year earlier they had generated 65.94 per cent of all electricity, so their share rose.
- Large hydro down, and short of its programme
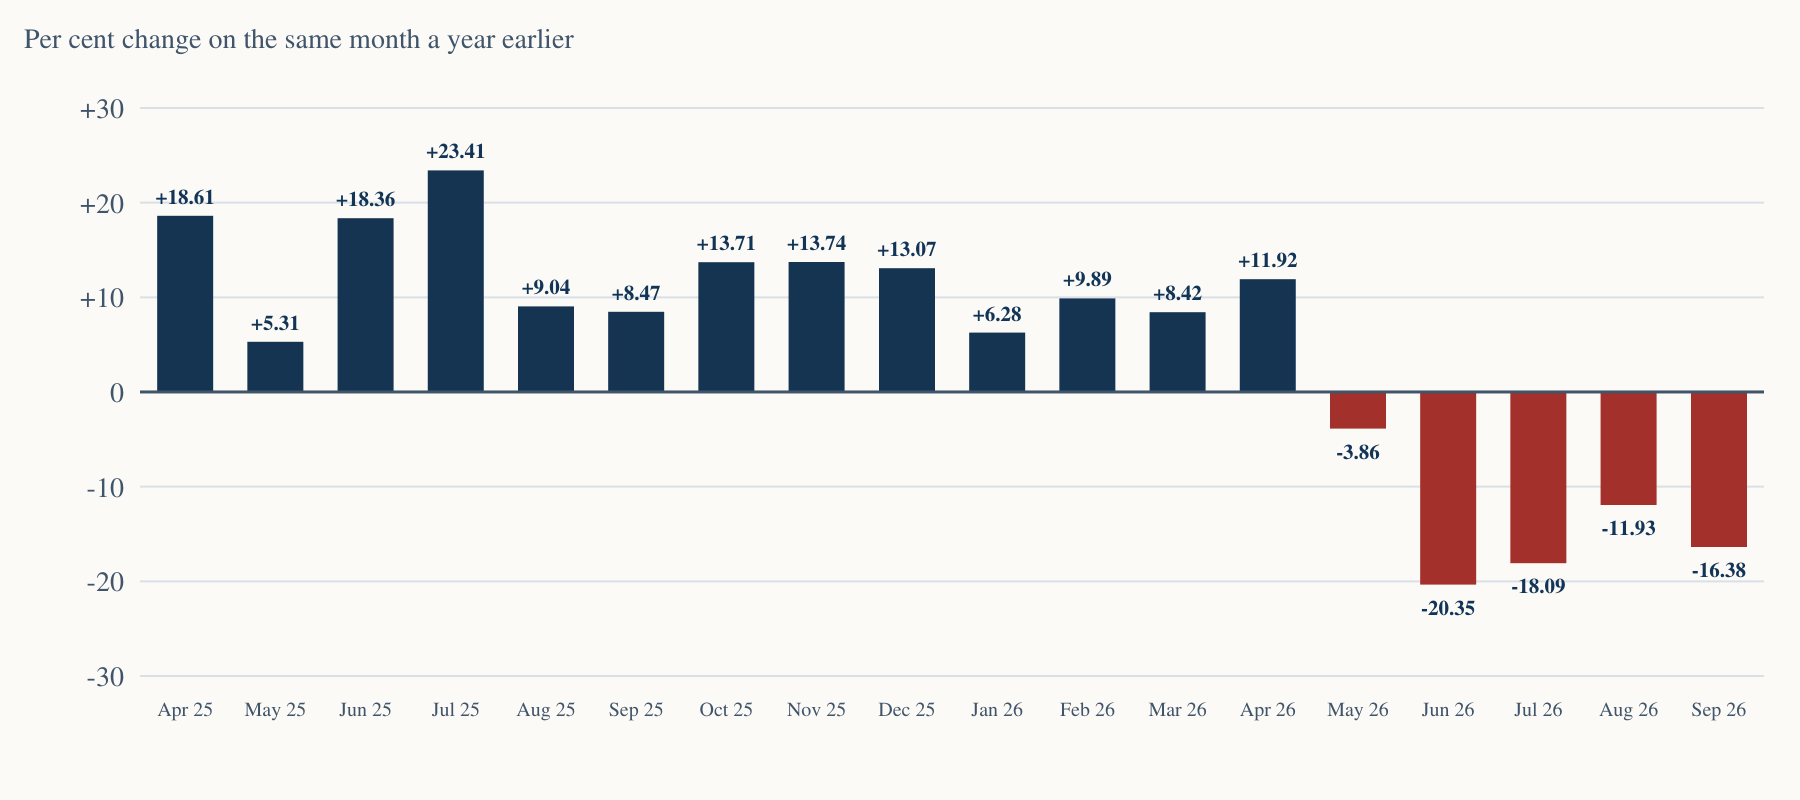
- Large hydro generation fell in September 2026. It was 16.38 per cent below September 2025. It was 12,577.27 MU short of the programme that CEA set for April to September.
- What the coming release is read against
- Fossil fuels generated 69.56 per cent of India's electricity in October 2025 and 74.06 per cent in November 2025.
Source: CEA, Broad Overview of RE Generation, April 2026 . CEA, Broad Overview of RE Generation, May 2026 . CEA, Broad Overview of RE Generation, June 2026 . CEA, Broad Overview of RE Generation, July 2026 . CEA, Broad Overview of RE Generation, August 2026 . CEA, Executive Summary on Power Sector, September 2026 . CEA, Broad Overview of RE Generation, April 2025 . CEA, Broad Overview of RE Generation, May 2025 . CEA, Broad Overview of RE Generation, June 2025 . CEA, Broad Overview of RE Generation, July 2025 . CEA, Broad Overview of RE Generation, August 2025 . CEA, Broad Overview of RE Generation, September 2025 .
Fossil-fuel generation above a year earlier, six months in a row
Fossil-fuel generation was higher than in the same month of 2025 in each month from April to September 2026: by 1.60, 8.77, 12.57, 12.19, 11.79 and 15.67 per cent.
View the figures in a table
From April to September 2026, fossil-fuel stations generated 7,21,809.38 MU, which is 10.21 per cent more than in the same months of 2025.
In September 2026 they generated 15,987.21 MU more than in September 2025. Renewable sources other than large hydro generated 5,946.50 MU more in the same month.
| Month | Fossil, 2026, MU | Fossil, 2025, MU | Change, per cent | Share 2026, per cent | Share 2025, per cent | Change, points |
|---|---|---|---|---|---|---|
| April 2026 | 1,20,977.60 | 1,19,070.49 | +1.60 | 72.76 | 75.61 | -2.85 |
| May 2026 | 1,24,107.52 | 1,14,095.95 | +8.77 | 70.06 | 71.71 | -1.65 |
| June 2026 | 1,22,493.78 | 1,08,811.65 | +12.57 | 68.66 | 68.12 | +0.54 |
| July 2026 | 1,19,359.44 | 1,06,393.46 | +12.19 | 65.94 | 64.31 | +1.63 |
| August 2026 | 1,16,870.51 | 1,04,541.85 | +11.79 | 64.42 | 65.33 | -0.91 |
| September 2026 | 1,18,000.53 | 1,02,013.32 | +15.67 | 67.74 | 66.05 | +1.69 |
| April to September | 7,21,809.38 | 6,54,926.72 | +10.21 |
Source: CEA, Broad Overview of RE Generation, April 2026 . CEA, Broad Overview of RE Generation, May 2026 . CEA, Broad Overview of RE Generation, June 2026 . CEA, Broad Overview of RE Generation, July 2026 . CEA, Broad Overview of RE Generation, August 2026 . CEA, Executive Summary on Power Sector, September 2026 . CEA, Broad Overview of RE Generation, April 2025 . CEA, Broad Overview of RE Generation, May 2025 . CEA, Broad Overview of RE Generation, June 2025 . CEA, Broad Overview of RE Generation, July 2025 . CEA, Broad Overview of RE Generation, August 2025 . CEA, Broad Overview of RE Generation, September 2025 .
Where the extra electricity came from, June to September 2026
CEA's monthly reports count 75,403.19 MU more electricity from June to September 2026 than from the same months of 2025, leaving out the import from Bhutan. Fossil-fuel stations generated 54,963.98 MU of that increase.
View the figures in a table
| Period | Change on June to September 2025 | Source |
|---|---|---|
| Fossil fuels | +54,963.98 MU | CEA, Executive Summary on Power Sector, September 2026 |
| Renewables other than large hydro | +29,879.87 MU | CEA, Executive Summary on Power Sector, September 2026 |
| Nuclear | +4,351.95 MU | CEA, Executive Summary on Power Sector, September 2026 |
| Large hydro | -13,792.61 MU | CEA, Executive Summary on Power Sector, September 2026 |
The four months run from June 2026, the month in which the fossil share first stood above its level a year earlier after 23 months below it.
That is 72.89 per cent of the extra electricity in CEA's monthly reports, against a share of 65.94 per cent of all generation a year earlier. Renewable sources other than large hydro added 29,879.87 MU, and large hydro generated 13,792.61 MU less than a year earlier.
| Source | June to September 2026 | June to September 2025 | Change |
|---|---|---|---|
| Fossil fuels | 4,76,724.26 | 4,21,760.28 | +54,963.98 |
| Renewables other than large hydro | 1,46,292.13 | 1,16,412.26 | +29,879.87 |
| Nuclear | 21,537.27 | 17,185.32 | +4,351.95 |
| Large hydro | 70,490.14 | 84,282.75 | -13,792.61 |
| All sources | 7,15,043.80 | 6,39,640.61 | +75,403.19 |
Source: CEA, Broad Overview of RE Generation, June 2026 . CEA, Broad Overview of RE Generation, July 2026 . CEA, Broad Overview of RE Generation, August 2026 . CEA, Executive Summary on Power Sector, September 2026 . CEA, Broad Overview of RE Generation, June 2025 . CEA, Broad Overview of RE Generation, July 2025 . CEA, Broad Overview of RE Generation, August 2025 . CEA, Broad Overview of RE Generation, September 2025 .
Large hydro fell, and fell short of CEA's programme
Large hydro generated 18,662.51 MU in September 2026, against 22,317.41 MU in September 2025. CEA's Table 1 prints that as 83.62 per cent of the year before, a fall of 16.38 per cent.
View the figures in a table
Large hydro generated less than in the same month a year earlier in each month from May to September 2026, by 11.93 per cent in August and 16.38 per cent in September.
From April to September 2026 large hydro fell 12,577.27 MU short of CEA's own programme for those months, reaching 88.20 per cent of it.
CEA counts large hydro as renewable energy. Counting it, renewable generation in September 2026 was 4.74 per cent above September 2025.
Source: CEA, Monthly RE Generation report, September 2026 . CEA, Broad Overview of RE Generation, September 2025 . CEA, Executive Summary on Power Sector, September 2026 . CEA, Broad Overview of RE Generation, April 2025 . CEA, Broad Overview of RE Generation, May 2025 . CEA, Broad Overview of RE Generation, June 2025 . CEA, Broad Overview of RE Generation, July 2025 . CEA, Broad Overview of RE Generation, August 2025 . CEA, Broad Overview of RE Generation, September 2025 . CEA, Broad Overview of RE Generation, October 2025 . CEA, Broad Overview of RE Generation, November 2025 . CEA, Broad Overview of RE Generation, December 2025 . CEA, Broad Overview of RE Generation, January 2026 . CEA, Broad Overview of RE Generation, February 2026 . CEA, Broad Overview of RE Generation, March 2026 . CEA, Broad Overview of RE Generation, April 2026 . CEA, Broad Overview of RE Generation, May 2026 . CEA, Broad Overview of RE Generation, June 2026 . CEA, Broad Overview of RE Generation, July 2026 . CEA, Broad Overview of RE Generation, August 2026 . CEA, Broad Overview of RE Generation, April 2024 . CEA, Broad Overview of RE Generation, May 2024 . CEA, Broad Overview of RE Generation, June 2024 . CEA, Broad Overview of RE Generation, July 2024 . CEA, Broad Overview of RE Generation, August 2024 . CEA, Broad Overview of RE Generation, September 2024 . CEA, Broad Overview of RE Generation, October 2024 . CEA, Broad Overview of RE Generation, November 2024 . CEA, Broad Overview of RE Generation, December 2024 . CEA, Broad Overview of RE Generation, January 2025 . CEA, Broad Overview of RE Generation, February 2025 . CEA, Broad Overview of RE Generation, March 2025 .
What the coming figures will be read against
CMIE's release calendar, read on 14 October 2026, lists 21 October to 3 November 2026 for CEA's final generation figures, 23 October to 2 November for its final renewable figures, and 2 to 12 November for its provisional generation figures. CEA's Executive Summary and renewable reports for September 2026, saved on 28 October 2026, are the latest this brief holds. The provisional figures that follow them are not out.
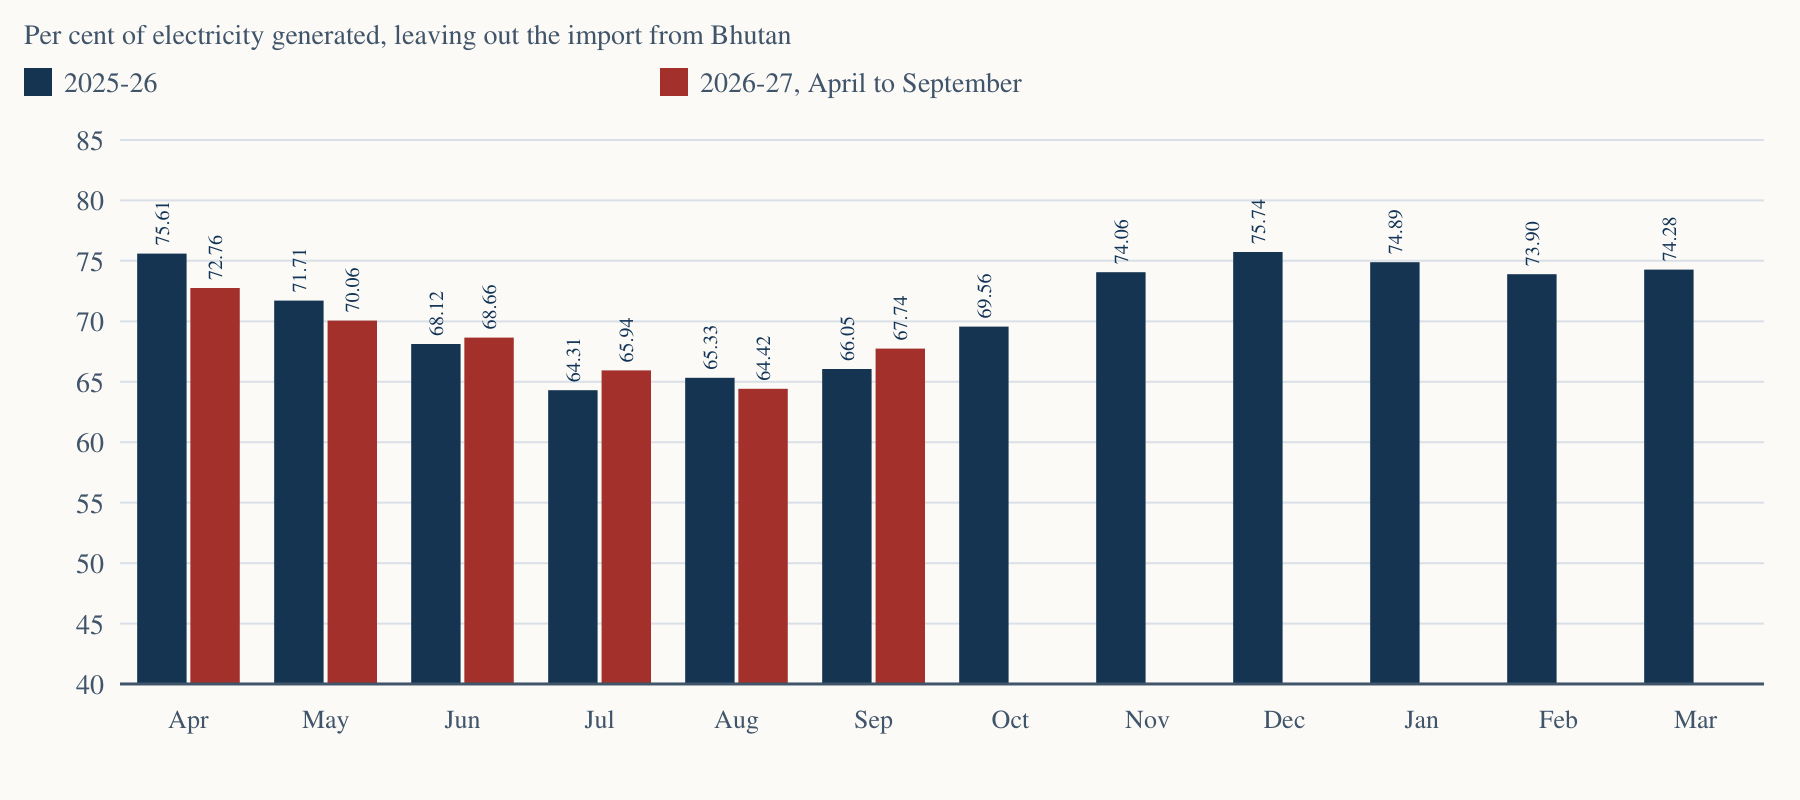
View the figures in a table
| Period | Fossil share | Source |
|---|---|---|
| Apr | 75.61 per cent in April 2025; 72.76 per cent in April 2026 | CEA, Broad Overview of RE Generation, April 2025 |
| May | 71.71 per cent in May 2025; 70.06 per cent in May 2026 | CEA, Broad Overview of RE Generation, May 2025 |
| Jun | 68.12 per cent in June 2025; 68.66 per cent in June 2026 | CEA, Broad Overview of RE Generation, June 2025 |
| Jul | 64.31 per cent in July 2025; 65.94 per cent in July 2026 | CEA, Broad Overview of RE Generation, July 2025 |
| Aug | 65.33 per cent in August 2025; 64.42 per cent in August 2026 | CEA, Broad Overview of RE Generation, August 2025 |
| Sep | 66.05 per cent in September 2025; 67.74 per cent in September 2026 | CEA, Broad Overview of RE Generation, September 2025 |
| Oct | 69.56 per cent in October 2025 | CEA, Broad Overview of RE Generation, October 2025 |
| Nov | 74.06 per cent in November 2025 | CEA, Broad Overview of RE Generation, November 2025 |
| Dec | 75.74 per cent in December 2025 | CEA, Broad Overview of RE Generation, December 2025 |
| Jan | 74.89 per cent in January 2026 | CEA, Broad Overview of RE Generation, January 2026 |
| Feb | 73.90 per cent in February 2026 | CEA, Broad Overview of RE Generation, February 2026 |
| Mar | 74.28 per cent in March 2026 | CEA, Broad Overview of RE Generation, March 2026 |
Whatever month a release covers will be read against the same month of 2025. In October 2025 fossil fuels generated 69.56 per cent of India's electricity, in November 2025 74.06 per cent, and in December 2025 75.74 per cent.
Every figure here comes from the month's own CEA report, as it was first printed. The table gives the months of 2025 in full, so that a new figure can be set against them line by line.
| Month | Fossil, MU | Large hydro, MU | Other renewables, MU | All, MU | Fossil share, per cent |
|---|---|---|---|---|---|
| October 2025 | 97,656.54 | 16,437.39 | 21,488.50 | 1,40,391.00 | 69.56 |
| November 2025 | 97,855.25 | 9,816.95 | 20,600.01 | 1,32,132.49 | 74.06 |
| December 2025 | 1,13,387.32 | 8,767.19 | 23,331.39 | 1,49,707.84 | 75.74 |
Source: CEA, Broad Overview of RE Generation, April 2025 . CEA, Broad Overview of RE Generation, May 2025 . CEA, Broad Overview of RE Generation, June 2025 . CEA, Broad Overview of RE Generation, July 2025 . CEA, Broad Overview of RE Generation, August 2025 . CEA, Broad Overview of RE Generation, September 2025 . CEA, Broad Overview of RE Generation, October 2025 . CEA, Broad Overview of RE Generation, November 2025 . CEA, Broad Overview of RE Generation, December 2025 . CEA, Broad Overview of RE Generation, January 2026 . CEA, Broad Overview of RE Generation, February 2026 . CEA, Broad Overview of RE Generation, March 2026 . CEA, Broad Overview of RE Generation, April 2026 . CEA, Broad Overview of RE Generation, May 2026 . CEA, Broad Overview of RE Generation, June 2026 . CEA, Broad Overview of RE Generation, July 2026 . CEA, Broad Overview of RE Generation, August 2026 . CEA, Executive Summary on Power Sector, September 2026 .
Every month from April to September 2026 saw fossil-fuel stations generate more electricity than the same month of 2025.
Downloads
Sources and terms
Every figure in this brief is taken from the reports of the Central Electricity Authority (CEA), or is worked out from them. CEA is the statutory technical body of the Ministry of Power. The reports are its monthly "Broad Overview of Monthly Renewable Energy Generation", its Executive Summary on the Power Sector for September 2026 and its Monthly Renewable Energy Generation Report for September 2026.
Each month's figures are read from the All India row of the report's table of fossil and non-fossil generation for that month, as the month's own report first printed it. CEA may later revise a month in a newer report.
September 2026 is the one exception. CEA's Broad Overview for that month is a workbook of renewable generation with no table of fossil generation, so the figures for September 2026 are read from the month's Executive Summary. For July and August 2026 the Executive Summary's figures for fossil fuels, nuclear, large hydro and renewable generation equal the Broad Overview's to the last decimal.
Generation is counted in million units (MU), where one MU is one million kilowatt hours. This brief counts generation only, and does not count capacity, which is measured in megawatts.
Fossil fuels are the stations CEA counts in its columns Thermal and Gas, which its table adds together as Fossil. In the Executive Summary the thermal block counts gas as well. CEA's total leaves out the electricity India imports from Bhutan.
Under a Ministry of Power order of 8 May 2019, CEA counts large hydro, which means hydro projects above 25 MW, as renewable energy. This brief says each time whether a renewable figure counts large hydro.
CEA's count of renewable generation covers the capacity it monitors, which is the capacity for which generation data is available. Its Table 1 prints the installed capacity and the monitored capacity side by side. Every renewable figure and every total in this brief therefore covers the monitored capacity only.
- Central Electricity Authority (CEA)
- The statutory technical body of the Ministry of Power, which publishes India's generation figures each month.
- Million units (MU)
- One million kilowatt hours of electricity generated.
- Fossil fuels
- The stations CEA counts in its columns Thermal and Gas, which its table adds together as Fossil.
- Large hydro
- Hydro projects above 25 MW, which CEA counts as renewable energy.
- Other renewables
- Wind, solar, biomass, bagasse, small hydro and other renewable sources, which CEA counts apart from large hydro.
- Share against a year earlier
- A month's share set against the same month a year before, in percentage points, so that the seasons cancel out.
- CEA, Broad Overview of RE Generation, April 2023 .
- CEA, Broad Overview of RE Generation, May 2023 .
- CEA, Broad Overview of RE Generation, June 2023 .
- CEA, Broad Overview of RE Generation, July 2023 .
- CEA, Broad Overview of RE Generation, August 2023 .
- CEA, Broad Overview of RE Generation, September 2023 .
- CEA, Broad Overview of RE Generation, October 2023 .
- CEA, Broad Overview of RE Generation, November 2023 .
- CEA, Broad Overview of RE Generation, December 2023 .
- CEA, Broad Overview of RE Generation, January 2024 .
- CEA, Broad Overview of RE Generation, February 2024 .
- CEA, Broad Overview of RE Generation, March 2024 .
- CEA, Broad Overview of RE Generation, April 2024 .
- CEA, Broad Overview of RE Generation, May 2024 .
- CEA, Broad Overview of RE Generation, June 2024 .
- CEA, Broad Overview of RE Generation, July 2024 .
- CEA, Broad Overview of RE Generation, August 2024 .
- CEA, Broad Overview of RE Generation, September 2024 .
- CEA, Broad Overview of RE Generation, October 2024 .
- CEA, Broad Overview of RE Generation, November 2024 .
- CEA, Broad Overview of RE Generation, December 2024 .
- CEA, Broad Overview of RE Generation, January 2025 .
- CEA, Broad Overview of RE Generation, February 2025 .
- CEA, Broad Overview of RE Generation, March 2025 .
- CEA, Broad Overview of RE Generation, April 2025 .
- CEA, Broad Overview of RE Generation, May 2025 .
- CEA, Broad Overview of RE Generation, June 2025 .
- CEA, Broad Overview of RE Generation, July 2025 .
- CEA, Broad Overview of RE Generation, August 2025 .
- CEA, Broad Overview of RE Generation, September 2025 .
- CEA, Broad Overview of RE Generation, October 2025 .
- CEA, Broad Overview of RE Generation, November 2025 .
- CEA, Broad Overview of RE Generation, December 2025 .
- CEA, Broad Overview of RE Generation, January 2026 .
- CEA, Broad Overview of RE Generation, February 2026 .
- CEA, Broad Overview of RE Generation, March 2026 .
- CEA, Broad Overview of RE Generation, April 2026 .
- CEA, Broad Overview of RE Generation, May 2026 .
- CEA, Broad Overview of RE Generation, June 2026 .
- CEA, Broad Overview of RE Generation, July 2026 .
- CEA, Broad Overview of RE Generation, August 2026 .
- CEA, Executive Summary on Power Sector, September 2026 .
- CEA, Monthly RE Generation report, September 2026 .