What PPAC's own figures show
April to September 2026 is set against April to September 2025 for each product, and the next report will be read against these figures.
- Six months, 3.3 per cent lower
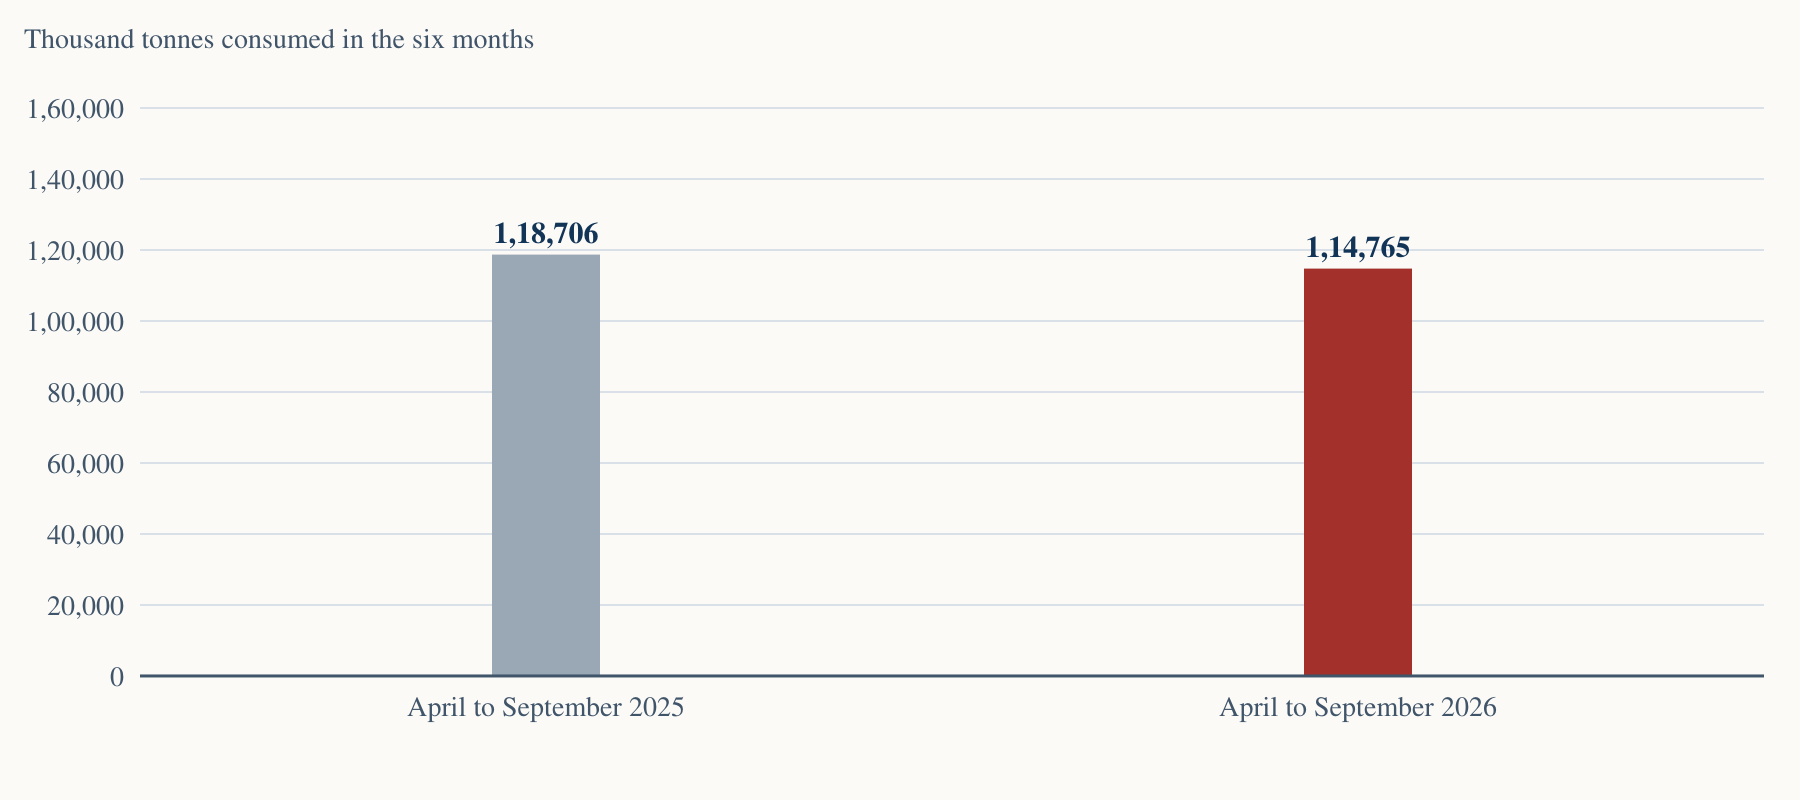
- Consumption was 1,14,765 thousand tonnes in April to September 2026, and PPAC says that it was 1,18,706 thousand tonnes in April to September 2025.
- LPG down 15.5 per cent
- LPG consumption was 13,705 thousand tonnes in April to September 2026, and PPAC says that it was 16,219 thousand tonnes in April to September 2025. Packed domestic LPG sold by the public sector oil companies fell 13.5 per cent, which PPAC prints in its LPG table.
- Seven of twelve products fell
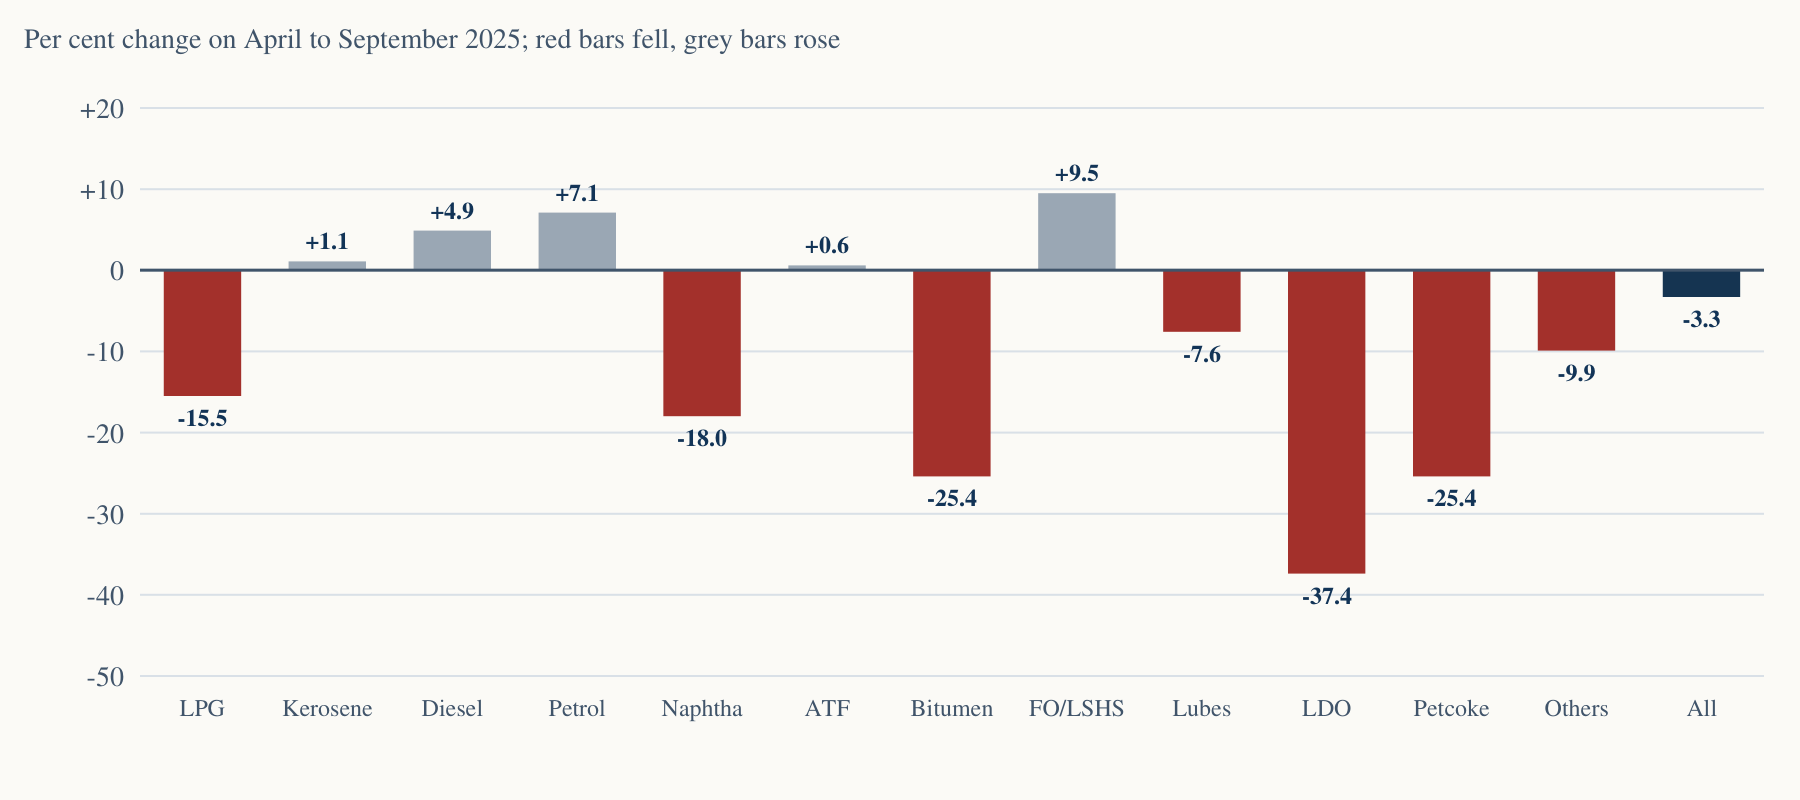
- India's consumption of seven of the twelve products was lower than in April to September 2025. The four that fell most in tonnes were LPG, petroleum coke, naphtha and bitumen, which fell by 15.5 per cent, 25.4 per cent, 18.0 per cent and 25.4 per cent over the six months, and by 7,140 thousand tonnes together.
- LPG lower in every window
- On PPAC's reports, LPG consumption was lower than a year earlier by 16.6 per cent in April to June (the office's arithmetic on the July report), 16.4 per cent in July, 17.1 per cent in August and 9.0 per cent in September 2026.
- Growth had already slowed
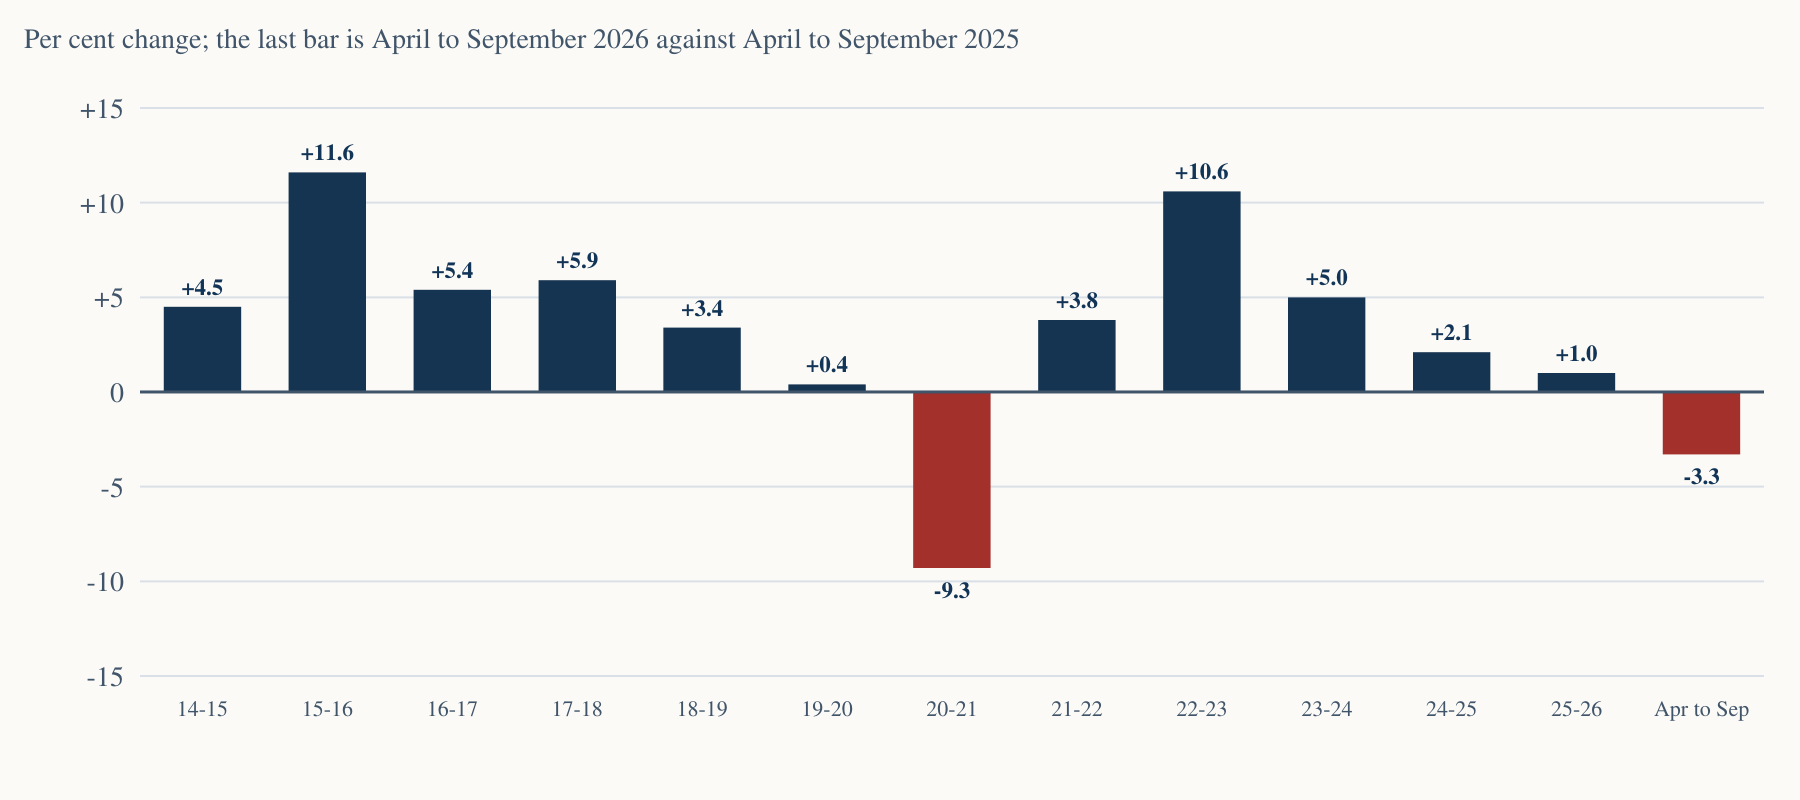
- Whole-year growth was 10.6 per cent in 2022-23, and it fell to 5.0 per cent in 2023-24, 2.1 per cent in 2024-25 and 1.0 per cent in 2025-26.
Source: PPAC, Snapshot of India's Oil and Gas Data, October 2026 (data for September 2026) .
Six months against the same six months of 2025
PPAC's Snapshot of October 2026 says that consumption of all petroleum products was 1,14,765 thousand tonnes in April to September 2026, and that it was 1,18,706 thousand tonnes in April to September 2025. That is 3,941 thousand tonnes, or 3.3 per cent, lower.
View the figures in a table
| Period | Thousand tonnes consumed | Source |
|---|---|---|
| April to September 2025 | 1,18,706 thousand tonnes | PPAC, Snapshot of India's Oil and Gas Data, October 2026 (data for September 2026) |
| April to September 2026 | 1,14,765 thousand tonnes | PPAC, Snapshot of India's Oil and Gas Data, October 2026 (data for September 2026) |
PPAC's summary in the same report gives the totals in million tonnes, and says that they were 114.8 in April to September 2026 and 118.7 in April to September 2025.
Consumption here is PPAC's measure, which counts the sales of the oil companies and private direct imports and sales from special economic zones. It is not a measure of production or of refinery output, and it counts imports only where private parties import directly, as PPAC's note says.
Source: PPAC, Snapshot of India's Oil and Gas Data, October 2026 (data for September 2026) .
Which products fell
LPG fell 15.5 per cent and naphtha fell 18.0 per cent, while bitumen fell 25.4 per cent and petroleum coke fell 25.4 per cent over the six months.
View the figures in a table
| Product | April to September 2025, thousand tonnes | April to September 2026, thousand tonnes | Change, thousand tonnes | Change, per cent |
|---|---|---|---|---|
| LPG | 16,219 | 13,705 | -2,514 | -15.5 |
| Kerosene | 212 | 215 | +3 | +1.1 |
| Diesel | 45,678 | 47,938 | +2,260 | +4.9 |
| Petrol | 21,189 | 22,698 | +1,509 | +7.1 |
| Naphtha | 5,901 | 4,841 | -1,060 | -18.0 |
| ATF | 4,418 | 4,443 | +25 | +0.6 |
| Bitumen | 3,719 | 2,776 | -943 | -25.4 |
| FO/LSHS | 3,012 | 3,297 | +285 | +9.5 |
| Lubricants | 2,382 | 2,200 | -182 | -7.6 |
| LDO | 509 | 319 | -190 | -37.4 |
| Petcoke | 10,330 | 7,707 | -2,623 | -25.4 |
| Others | 5,136 | 4,626 | -510 | -9.9 |
| All products | 1,18,706 | 1,14,765 | -3,941 | -3.3 |
Source: PPAC, Snapshot of India's Oil and Gas Data, October 2026 (data for September 2026) .
Where the fall came from, in tonnes
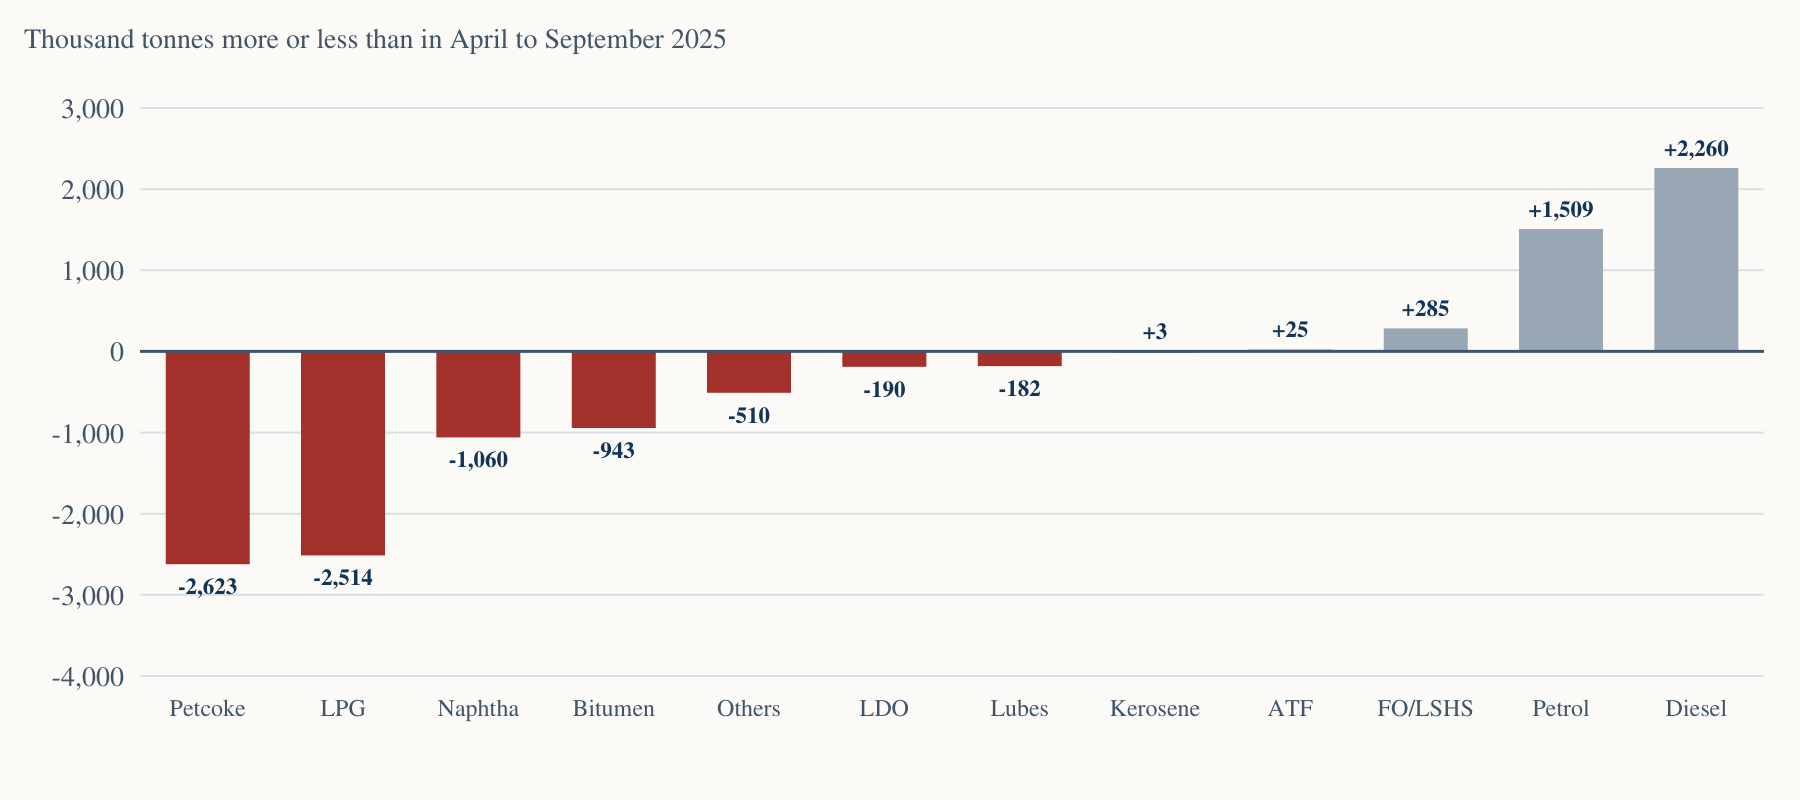
In tonnes, the four products that fell most were LPG, petroleum coke, naphtha and bitumen. India's consumption of the four together was 7,140 thousand tonnes lower in April to September 2026 than in the same months of 2025. Consumption of petroleum coke fell by 2,623 thousand tonnes, and consumption of LPG fell by 2,514 thousand tonnes.
View the figures in a table
The twelve products' changes add to -3,940 against -3,941 for the total, and the difference of 1 thousand tonne is rounding in the volumes that PPAC prints.
Source: PPAC, Snapshot of India's Oil and Gas Data, October 2026 (data for September 2026) .
LPG, in every window
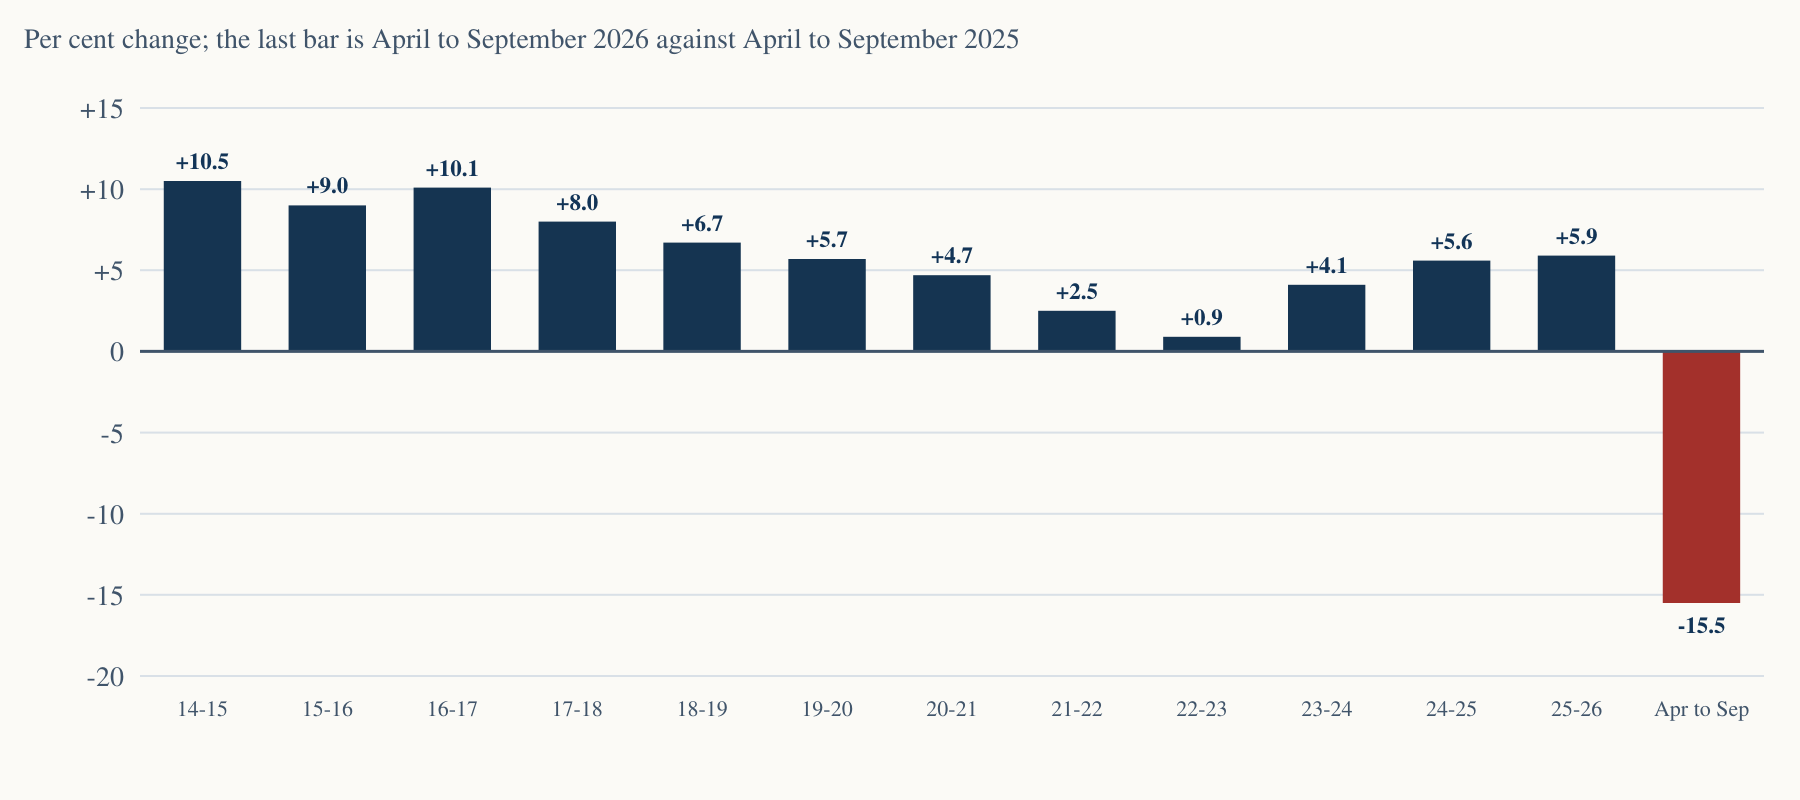
LPG consumption was 13,705 thousand tonnes in April to September 2026, against 16,219 thousand tonnes in April to September 2025, a fall of 2,514 thousand tonnes. PPAC's table of LPG by category says that packed domestic LPG sold by the public sector companies, which the table lists under PSU Sales, fell 13.5 per cent over the six months and 8.5 per cent in September alone.
View the figures in a table
| Period | Against the year before | Source |
|---|---|---|
| 2014-15 | +10.5 per cent | PPAC, Ready Reckoner, 2025-26 |
| 2015-16 | +9.0 per cent | PPAC, Ready Reckoner, 2025-26 |
| 2016-17 | +10.1 per cent | PPAC, Ready Reckoner, 2025-26 |
| 2017-18 | +8.0 per cent | PPAC, Ready Reckoner, 2025-26 |
| 2018-19 | +6.7 per cent | PPAC, Ready Reckoner, 2025-26 |
| 2019-20 | +5.7 per cent | PPAC, Ready Reckoner, 2025-26 |
| 2020-21 | +4.7 per cent | PPAC, Ready Reckoner, 2025-26 |
| 2021-22 | +2.5 per cent | PPAC, Ready Reckoner, 2025-26 |
| 2022-23 | +0.9 per cent | PPAC, Ready Reckoner, 2025-26 |
| 2023-24 | +4.1 per cent | PPAC, Ready Reckoner, 2025-26 |
| 2024-25 | +5.6 per cent | PPAC, Ready Reckoner, 2025-26 |
| 2025-26 | +5.9 per cent | PPAC, Ready Reckoner, 2025-26 |
| April to September 2026 | -15.5 per cent | PPAC, Snapshot of India's Oil and Gas Data, October 2026 (data for September 2026) |
LPG consumption was lower than a year earlier in each of the four windows below, and each window comes from the latest PPAC report from which it can be read. April to June is the April to July total less July, both of which the report for July prints.
LPG consumption in July 2026 was 2,349 thousand tonnes, which was the lowest of the five Julys from 2022 to 2026, and July 2023 was next lowest at 2,390 thousand tonnes. In August 2026 it was 2,347 thousand tonnes, which was the lowest of the five Augusts, and August 2022 was next lowest at 2,388 thousand tonnes.
PPAC's Table 6.2 shows that LPG consumption was higher than in the year before, in each of the 12 whole years from 2014-15 to 2025-26. The table does not print earlier years and carries no note of its own; Table 6.1, which prints the volumes of those years, says that online SEZ data are included from 2017-18 onwards.
| Window (the report it is read from) | 2026, thousand tonnes | 2025, thousand tonnes | Change, per cent |
|---|---|---|---|
| April to June 2026 (July report) | 6,492 | 7,780 | -16.6 |
| July 2026 (July report) | 2,349 | 2,810 | -16.4 |
| August 2026 (August report) | 2,347 | 2,833 | -17.1 |
| September 2026 (Snapshot) | 2,544 | 2,794 | -9.0 |
| April to September 2026 (Snapshot) | 13,705 | 16,219 | -15.5 |
Source: PPAC, Snapshot of India's Oil and Gas Data, October 2026 (data for September 2026) ; PPAC, Industry Consumption Report, POL and NG, July 2026 ; PPAC, Industry Consumption Report, POL and NG, August 2026 ; PPAC, Ready Reckoner, 2025-26 .
Whole years, to 2025-26
PPAC's Table 4.6 gives whole-year consumption of petroleum products from 1997-98 to 2025-26. Its volumes fell from 214.1 million tonnes in 2019-20 to 194.3 million tonnes in 2020-21, which Table 6.2 prints as a fall of 9.3 per cent, and that is the one fall in the 28 year-on-year comparisons.
View the figures in a table
| Period | Against the year before | Source |
|---|---|---|
| 2014-15 | +4.5 per cent | PPAC, Ready Reckoner, 2025-26 |
| 2015-16 | +11.6 per cent | PPAC, Ready Reckoner, 2025-26 |
| 2016-17 | +5.4 per cent | PPAC, Ready Reckoner, 2025-26 |
| 2017-18 | +5.9 per cent | PPAC, Ready Reckoner, 2025-26 |
| 2018-19 | +3.4 per cent | PPAC, Ready Reckoner, 2025-26 |
| 2019-20 | +0.4 per cent | PPAC, Ready Reckoner, 2025-26 |
| 2020-21 | -9.3 per cent | PPAC, Ready Reckoner, 2025-26 |
| 2021-22 | +3.8 per cent | PPAC, Ready Reckoner, 2025-26 |
| 2022-23 | +10.6 per cent | PPAC, Ready Reckoner, 2025-26 |
| 2023-24 | +5.0 per cent | PPAC, Ready Reckoner, 2025-26 |
| 2024-25 | +2.1 per cent | PPAC, Ready Reckoner, 2025-26 |
| 2025-26 | +1.0 per cent | PPAC, Ready Reckoner, 2025-26 |
| April to September 2026 | -3.3 per cent | PPAC, Snapshot of India's Oil and Gas Data, October 2026 (data for September 2026) |
Growth slowed in each year after 2022-23. It was 10.6 per cent that year, then 5.0 per cent, 2.1 per cent and 1.0 per cent in 2025-26.
Source: PPAC, Ready Reckoner, 2025-26 ; PPAC, Snapshot of India's Oil and Gas Data, October 2026 (data for September 2026) .
In the six months to September 2026, India's consumption of petroleum products was 3.3 per cent lower than a year earlier, and its consumption of LPG was 15.5 per cent lower, as PPAC's Snapshot shows.
Downloads
Sources and terms
Every figure in this brief comes from the Government's own Petroleum Planning and Analysis Cell (PPAC), which is the statistics office of the Ministry of Petroleum and Natural Gas, or is worked out from its published volumes. The brief draws on five of its reports: the Snapshot of India's Oil and Gas Data for October 2026, the Industry Consumption Reports for July, August and September 2026, and the Ready Reckoner for 2025-26. The report for September 2026 prints the same September and April to September figures as the Snapshot, line by line.
Consumption is PPAC's measure, which counts the sales of the oil companies in the domestic market and private direct imports and sales from special economic zones. It is not production or refinery output, and it counts imports only where private parties import directly.
PPAC prints each month more than once and may change it. This brief takes each figure from the latest PPAC report held from which it can be read, and names the report where windows come from different reports. All 2026 figures are provisional.
Quantities are in thousand tonnes (TMT) or million tonnes (MMT). A per cent change is the one PPAC prints, except for April to June 2026, which this brief computes from the July report as the April to July total less July. Where this brief computes a change in tonnes, it subtracts PPAC's printed volumes.
The change for April to September 2026 is always measured against April to September 2025. It is never measured against a financial year, even where a chart shows it beside the whole-year changes.
Petrol consumption includes ethanol blending, as PPAC's tables note, and PPAC's whole-year series includes sales from special economic zones from 2017-18 onwards.
- Petroleum Planning and Analysis Cell (PPAC)
- The statistics office of the Ministry of Petroleum and Natural Gas, which publishes India's consumption figures each month.
- Consumption
- PPAC's measure: the sales of the oil companies, plus private direct imports, plus sales from special economic zones.
- Thousand tonnes (TMT)
- A unit of one thousand metric tonnes, so that a million tonnes is a thousand of them.
- LPG
- Liquefied petroleum gas, sold in cylinders to households and to businesses.
- Petroleum coke
- A solid fuel and industrial feedstock made in refineries.
- Naphtha
- A liquid made in refineries, used as feedstock for fertiliser and chemicals.
- Bitumen
- The black binder refineries make for surfacing roads.