The record
In FY 2024-25, the average speed of goods trains was 23.4 km per hour, which was 6.4 per cent lower than a year earlier, and FY 2024-25 is still the latest year that the dashboard gives for the railways.
Source: MoSPI, PAIMANA Performance Monitoring Dashboard, civil aviation, 16 October 2026 ; MoSPI, PAIMANA Performance Monitoring Dashboard, railways, 16 October 2026 .
Sector by sector
MoSPI's PAIMANA Performance Monitoring Dashboard is the Government's own record of six infrastructure sectors, and its quarterly update of 16 October 2026 moved the airline cards to August 2026 and the roads cards to September 2026. The railway cards still end in March 2025, so each sector's figures cover a different period.
| Sector and period | What the dashboard shows |
|---|---|
| Civil aviation, FY 2026-27 up to August | In FY 2026-27 up to August, Indian scheduled airlines carried 4.6 per cent fewer passengers than a year earlier, and their revenue passenger kilometres were 8.8 per cent lower. |
| Railways, FY 2024-25 | In FY 2024-25, the average speed of goods trains was 6.4 per cent lower than a year earlier, and net tonne kilometres per wagon per day were 7.1 per cent lower. |
| Roads, FY 2026-27 up to September | In FY 2026-27 up to September, National Highways constructed were 18.6 per cent less than a year earlier, while electronic toll collections were 11.7 per cent higher. |
| Power, for the period the card labels FY 2025-26 | For the period that the card labels FY 2025-26, with its figures as on February 2026, interruptions of supply per customer outside agriculture were 5 per cent more than a year earlier. |
| Ports, FY 2024-25 and calendar year 2025 | In FY 2024-25, passenger traffic at major ports was 7.9 per cent lower than a year earlier, and in calendar year 2025 the people employed at major and non-major ports were 9.7 per cent fewer. |
On MoSPI's own dashboard as updated on 16 October 2026, each of these cards reads worse than a year earlier, each for its own period: airline traffic in FY 2026-27 up to August; the speed of goods trains in FY 2024-25; highway construction in FY 2026-27 up to September; interruptions of supply per customer outside agriculture, for the period the card labels FY 2025-26 with its figures as on February 2026; and passenger traffic at major ports in FY 2024-25.
1. Civil aviation: the paying traffic of Indian scheduled airlines was 8.8 per cent lower in FY 2026-27 up to August than a year earlier
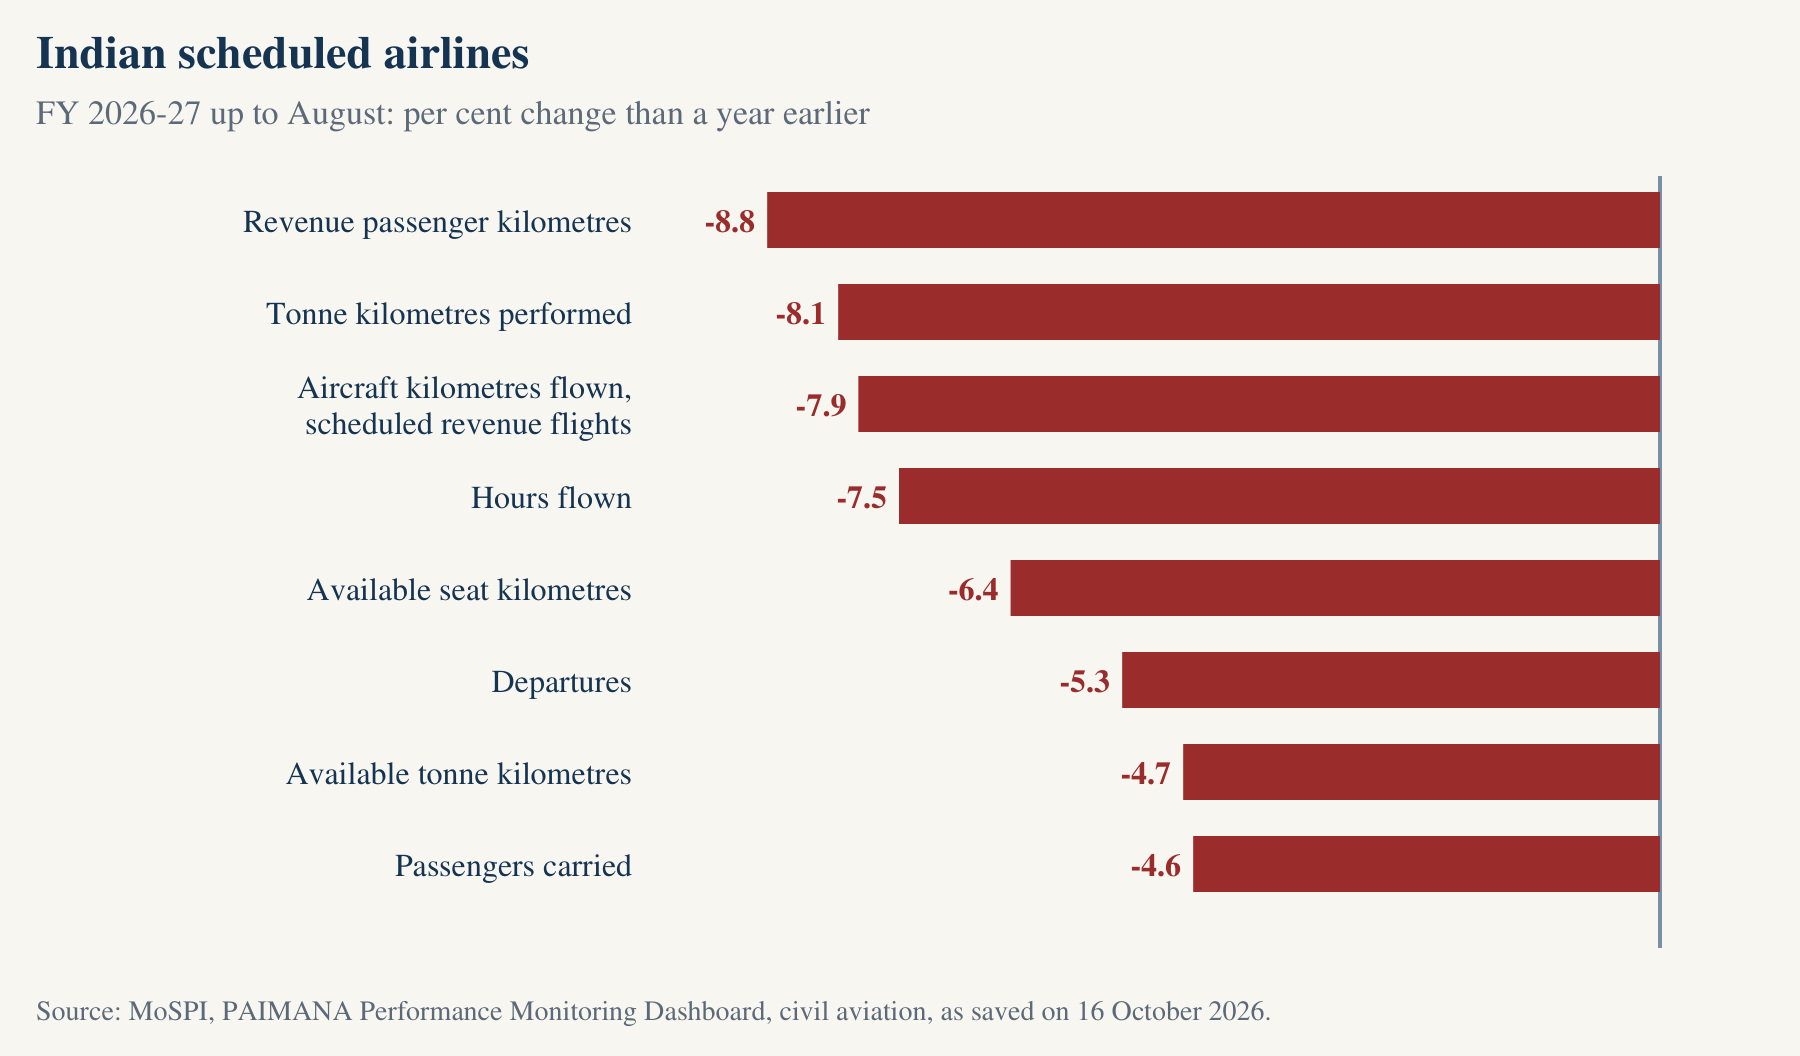
On MoSPI's PAIMANA infrastructure dashboard, as updated on 16 October 2026, the revenue passenger kilometres of Indian scheduled airlines were 8.8 per cent lower in FY 2026-27 up to August, which is April to August 2026, than a year earlier. Each of the eleven airline cards that print a change for those months is lower than a year earlier, and the airlines carried 7.87 crore passengers, 4.6 per cent fewer.
In FY 2026-27 up to August, the available seat kilometres of Indian scheduled airlines were 6.4 per cent lower than a year earlier; their hours flown were 7.5 per cent lower; and their departures were 5.3 per cent lower.
In FY 2026-27 up to August, the tonne kilometres performed by Indian scheduled airlines were 8.1 per cent lower than a year earlier; their aircraft kilometres flown on scheduled revenue flights were 7.9 per cent lower; and their available tonne kilometres were 4.7 per cent lower.
This means that in FY 2026-27 up to August, Indian scheduled airlines flew fewer paying passengers over fewer kilometres, and offered fewer seat kilometres, than in the same months a year earlier.
Source: MoSPI, PAIMANA Performance Monitoring Dashboard, civil aviation, 16 October 2026 .
View the figures in a table
| Card | Period | Change, per cent | Source |
|---|---|---|---|
| Revenue passenger kilometres | FY 2026-27 up to August | -8.8 | MoSPI, PAIMANA dashboard, civil aviation |
| Tonne kilometres performed | FY 2026-27 up to August | -8.1 | MoSPI, PAIMANA dashboard, civil aviation |
| Aircraft kilometres flown, scheduled revenue flights | FY 2026-27 up to August | -7.9 | MoSPI, PAIMANA dashboard, civil aviation |
| Hours flown | FY 2026-27 up to August | -7.5 | MoSPI, PAIMANA dashboard, civil aviation |
| Available seat kilometres | FY 2026-27 up to August | -6.4 | MoSPI, PAIMANA dashboard, civil aviation |
| Departures | FY 2026-27 up to August | -5.3 | MoSPI, PAIMANA dashboard, civil aviation |
| Available tonne kilometres | FY 2026-27 up to August | -4.7 | MoSPI, PAIMANA dashboard, civil aviation |
| Passengers carried | FY 2026-27 up to August | -4.6 | MoSPI, PAIMANA dashboard, civil aviation |
The airline cards come from the Directorate General of Civil Aviation and cover Indian scheduled operators only. Passengers carried, hours flown and departures count their scheduled and non-scheduled services, and the other cards count their scheduled operations. Aircraft kilometres count scheduled revenue flights only.
2. Civil aviation: fewer aircraft movements and fewer passengers handled at airports in FY 2026-27 up to August
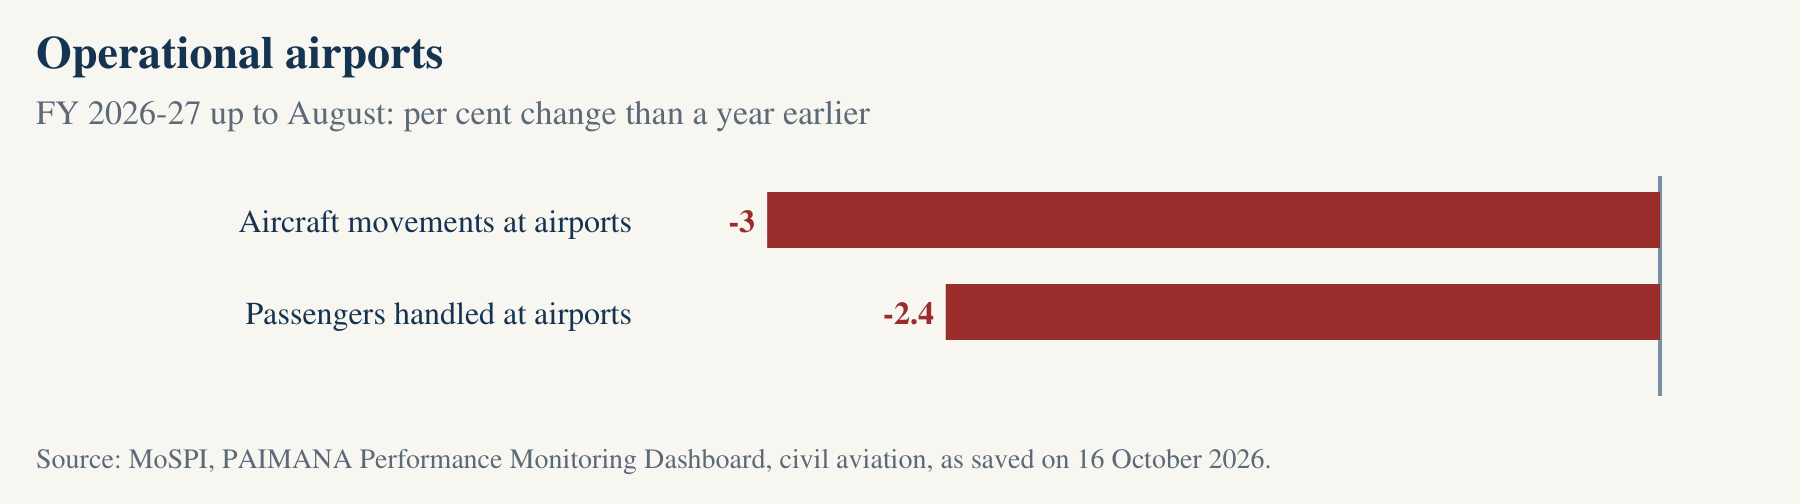
At the country's operational airports, aircraft movements in FY 2026-27 up to August were 11.6 lakh, which was 3 per cent fewer than a year earlier. Passengers handled at those airports in FY 2026-27 up to August were 16.6 crore, which was 2.4 per cent fewer than a year earlier.
The Airports Authority of India counts these cards at all operational airports, and its aircraft movements include foreign aircraft as well as Indian ones. Passengers handled count the traffic at airports, which is a different measure from the passengers that Indian scheduled airlines carried.
In FY 2026-27 up to August, the country's airports saw fewer take-offs and landings, and handled fewer passengers, than in the same months a year earlier.
Source: MoSPI, PAIMANA Performance Monitoring Dashboard, civil aviation, 16 October 2026 .
View the figures in a table
| Card | Period | Change, per cent | Source |
|---|---|---|---|
| Aircraft movements at airports | FY 2026-27 up to August | -3 | MoSPI, PAIMANA dashboard, civil aviation |
| Passengers handled at airports | FY 2026-27 up to August | -2.4 | MoSPI, PAIMANA dashboard, civil aviation |
3. Railways: goods trains ran slower in FY 2024-25, the latest year the dashboard gives for the railways
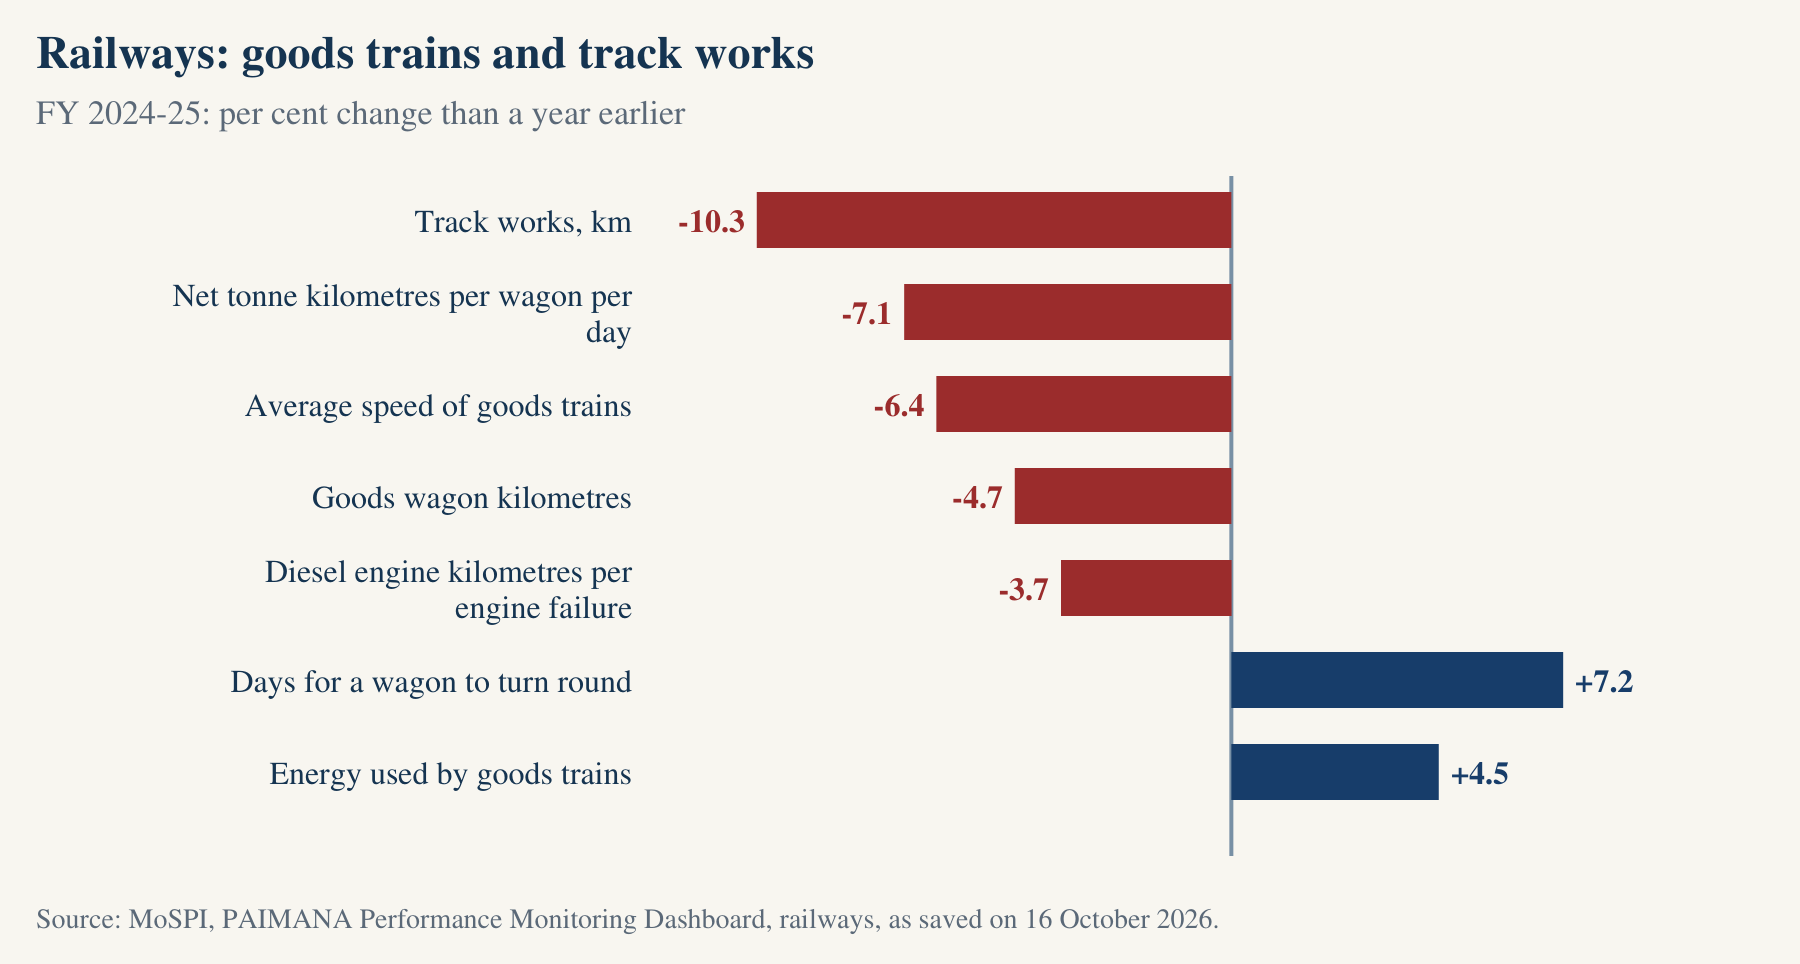
In FY 2024-25, which is still the latest year that the dashboard gives for the railways after its update of 16 October 2026, the average speed of goods trains was 23.4 km per hour, which was 6.4 per cent lower than a year earlier. In FY 2024-25, net tonne kilometres per broad gauge wagon per day were 7,292, which was 7.1 per cent lower than a year earlier; and the time a broad gauge wagon took to turn round was 5.5 days, which was 7.2 per cent longer.
In FY 2024-25, goods wagons ran 22,841 million wagon kilometres, which was 4.7 per cent fewer than a year earlier; and track works covered 10,099 km, which was 10.3 per cent less.
In FY 2024-25, diesel electric engines on the broad gauge ran 197,458 km for each engine failure, which was 3.7 per cent fewer than a year earlier. In FY 2024-25, the energy that goods trains used for every thousand gross tonne kilometres, in a unit that the card does not print, was 4.5 per cent higher than a year earlier.
In FY 2024-25, on the Ministry of Railways' own figures, freight trains moved more slowly and each wagon did less work each day than a year earlier.
Source: MoSPI, PAIMANA Performance Monitoring Dashboard, railways, 16 October 2026 .
View the figures in a table
| Card | Period | Change, per cent | Source |
|---|---|---|---|
| Track works, km | FY 2024-25 | -10.3 | MoSPI, PAIMANA dashboard, railways |
| Net tonne kilometres per wagon per day | FY 2024-25 | -7.1 | MoSPI, PAIMANA dashboard, railways |
| Average speed of goods trains | FY 2024-25 | -6.4 | MoSPI, PAIMANA dashboard, railways |
| Goods wagon kilometres | FY 2024-25 | -4.7 | MoSPI, PAIMANA dashboard, railways |
| Diesel engine kilometres per engine failure | FY 2024-25 | -3.7 | MoSPI, PAIMANA dashboard, railways |
| Days for a wagon to turn round | FY 2024-25 | +7.2 | MoSPI, PAIMANA dashboard, railways |
| Energy used by goods trains | FY 2024-25 | +4.5 | MoSPI, PAIMANA dashboard, railways |
The cards name the Ministry of Railways as their source and give their figures as on 31 March 2025. The average speed counts operational halts such as crossings, signal stops and yard detention. The goods wagon card is named for the length of the network, but its description says that it measures the distance wagons travelled.
4. Railways: more compensation claims received, and fewer claims paid, in FY 2024-25
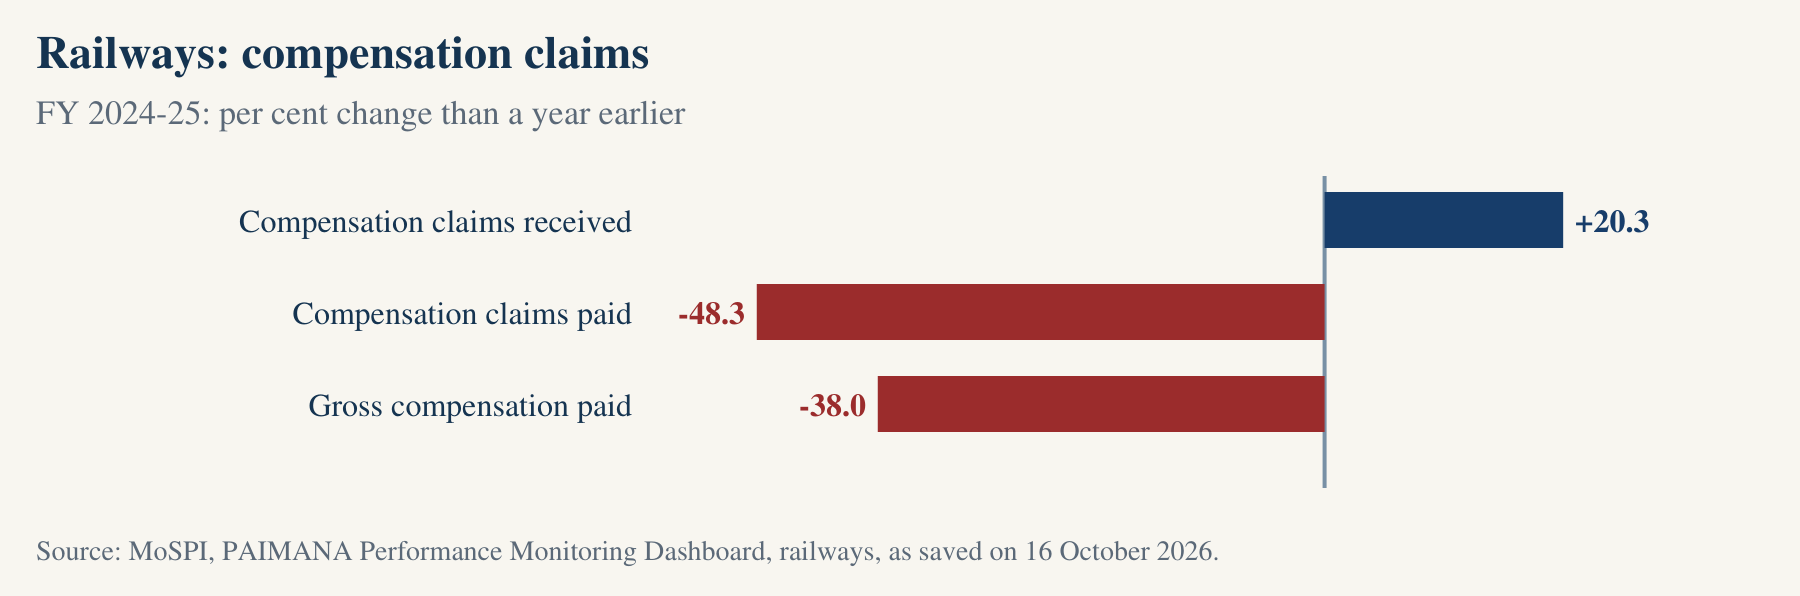
In FY 2024-25, the railways received 3,732 compensation claims, which was 20.3 per cent more than a year earlier. In FY 2024-25, they paid 78 claims, which was 48.3 per cent fewer than a year earlier; and their gross compensation paid was ₹4.98 crore, which was 38.0 per cent less.
In its own words, the card counts claims 'for incidents such as accidents, injuries, fatalities, or loss/damage of goods'. It does not say whether a claim paid in FY 2024-25 was received in the same year, so the claims paid are not read as a share of the claims received.
In FY 2024-25, the railways received more claims for compensation than a year earlier, while the number of claims they paid and the money they paid out were both lower.
Source: MoSPI, PAIMANA Performance Monitoring Dashboard, railways, 16 October 2026 .
View the figures in a table
| Card | Period | Change, per cent | Source |
|---|---|---|---|
| Compensation claims received | FY 2024-25 | +20.3 | MoSPI, PAIMANA dashboard, railways |
| Compensation claims paid | FY 2024-25 | -48.3 | MoSPI, PAIMANA dashboard, railways |
| Gross compensation paid | FY 2024-25 | -38.0 | MoSPI, PAIMANA dashboard, railways |
5. Roads: less highway built and less capital spent, and more collected in tolls, in FY 2026-27 up to September
In FY 2026-27 up to September, which is April to September 2026, the dashboard prints 2,369.46 km of National Highways constructed, which was 18.6 per cent less than a year earlier. In FY 2026-27 up to September, the roads ministry's actual capital expenditure was ₹1,58,998 crore, which was 5.8 per cent lower than a year earlier.
In FY 2026-27 up to September, electronic toll collections were ₹36,994.45 crore, which was 11.7 per cent higher than a year earlier; and electronic toll transactions were 225.24 crore, which was 24.1 per cent more.
In FY 2026-27 up to September, less National Highway was built and the roads ministry spent less capital than a year earlier, while the total collected in electronic tolls was higher.
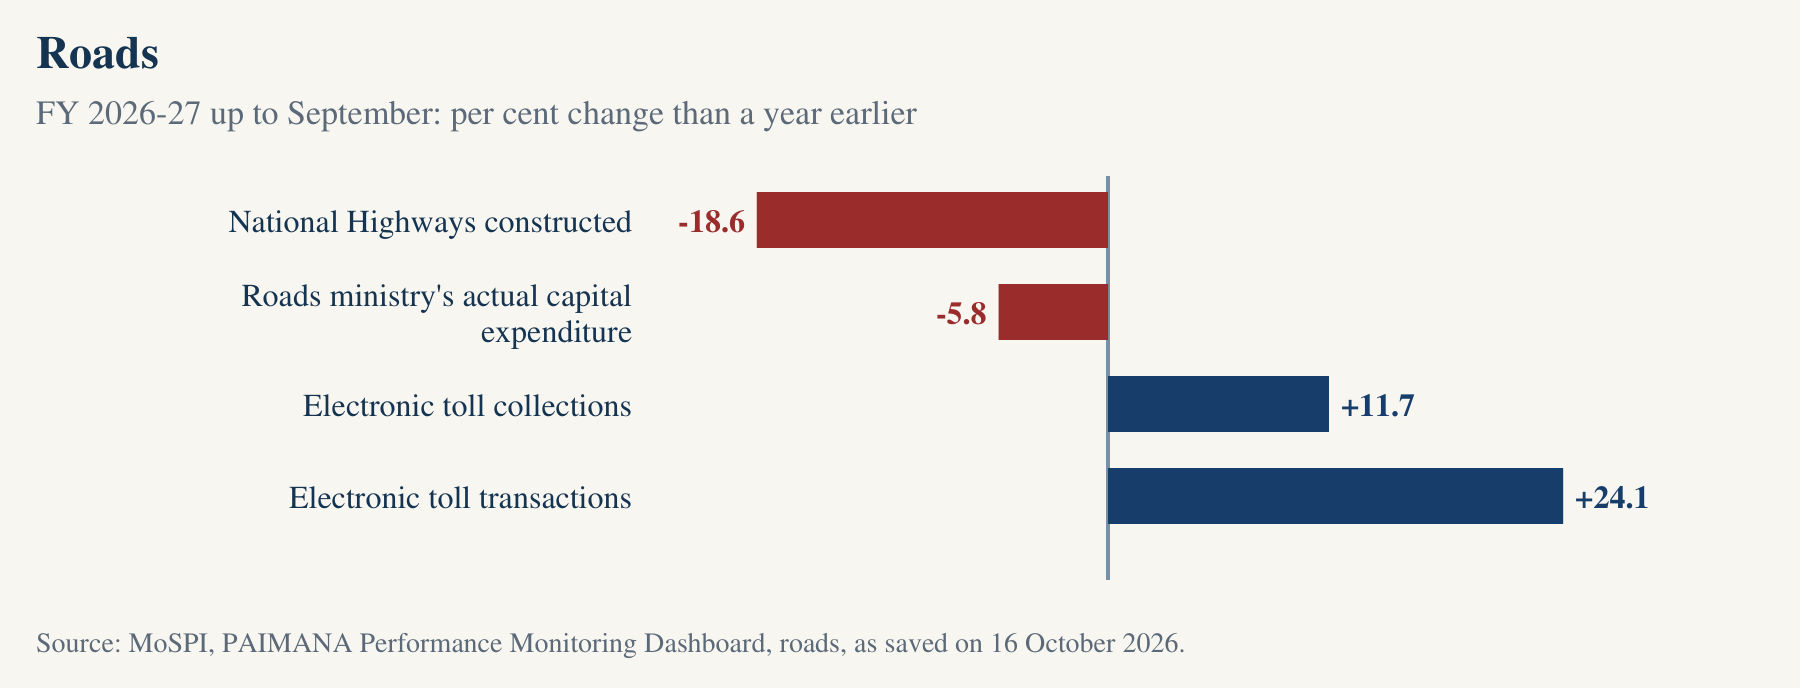
Source: MoSPI, PAIMANA Performance Monitoring Dashboard, roads, 16 October 2026 .
View the figures in a table
| Card | Period | Change, per cent | Source |
|---|---|---|---|
| National Highways constructed | FY 2026-27 up to September | -18.6 | MoSPI, PAIMANA dashboard, roads |
| Roads ministry's actual capital expenditure | FY 2026-27 up to September | -5.8 | MoSPI, PAIMANA dashboard, roads |
| Electronic toll collections | FY 2026-27 up to September | +11.7 | MoSPI, PAIMANA dashboard, roads |
| Electronic toll transactions | FY 2026-27 up to September | +24.1 | MoSPI, PAIMANA dashboard, roads |
The construction card counts linear length, irrespective of how many lanes a section has. The capital expenditure card counts the ministry's spending on National Highway construction and related infrastructure projects. Toll collections and transactions are totals. The cards name the Ministry of Road Transport and Highways as their source.
6. Power: interruptions of supply outside agriculture were more frequent, for the period the card labels FY 2025-26
For the period that the dashboard labels FY 2025-26, with its figures as on February 2026, interruptions of supply per customer outside agriculture were 5 per cent more than a year earlier. For the period that it labels FY 2025-26 (Feb, 2026), the card for the average duration of interruptions outside agriculture printed a rise of 35.2 per cent on a year earlier.
This means that, for the period the card labels FY 2025-26, customers outside agriculture had their supply interrupted more often than a year earlier.
| Card | Period | Change |
|---|---|---|
| Interruptions of supply per customer, outside agriculture | FY 2025-26 | 5 per cent higher than a year earlier |
| Average duration of interruptions, outside agriculture | FY 2025-26 (Feb, 2026) | 35.2 per cent higher than a year earlier |
Each card keeps its own period, so the two rows are not years of one series and are not compared with one another.
Source: MoSPI, PAIMANA Performance Monitoring Dashboard, power, 16 October 2026 .
The duration card describes its figure as the average time without supply per consumer, while its hover title calls it the length of one interruption, so this brief gives the figure as the card names it. Both cards are dated as on February 2026, and neither says whether its period is February 2026 alone or the year up to February 2026. The cards name the Central Electricity Authority as their source.
7. Ports: fewer passengers at major ports in FY 2024-25, and fewer people employed at ports in calendar year 2025
In FY 2024-25, passenger traffic at major ports was 5,85,900, which was 7.9 per cent fewer than a year earlier. In calendar year 2025, the people employed at major and non-major ports numbered 27,144, which was 9.7 per cent fewer than a year earlier.
This means that major ports handled fewer passengers in FY 2024-25, and the country's ports employed fewer people in calendar year 2025, than a year earlier.
| Card | Period | Level | Change |
|---|---|---|---|
| Passenger traffic at major ports | FY 2024-25 | 5,85,900 | 7.9 per cent lower than a year earlier |
| People employed at major and non-major ports | calendar year 2025 | 27,144 | 9.7 per cent lower than a year earlier |
The passenger card is for FY 2024-25, and the employment card is for calendar year 2025.
Source: MoSPI, PAIMANA Performance Monitoring Dashboard, ports, shipping and waterways, 16 October 2026 .
Each card keeps its own period. The passenger card prints major ports only, and the employment card prints one figure for major and non-major ports together. Both cards name the Ministry of Ports, Shipping and Waterways as their source.
8. How the dashboard measures: no road construction is set against a target
MoSPI's release of 16 April 2026, which launched the dashboard, said that the framework then in use assessed sectoral performance by growth rates, achievement against targets and capacity utilisation in select sectors. None of the roads cards on the dashboard, as updated on 16 October 2026, sets construction against a target.
MoSPI's own publications listing, read on 15 October 2026, carries no monthly review of the key infrastructure sectors after the one for January 2026, which was released on 16 March 2026. That review said that it measured each sector against its monthly targets.
The Government's own dashboard shows how much highway was built, but not how that compares with any target.
| Document | Date | What it shows |
|---|---|---|
| MoSPI's release launching the dashboard | 16 April 2026 | The framework then in use assessed achievement against targets |
| MoSPI's monthly review for January 2026 | released 16 March 2026 | The review measured each sector against its monthly targets |
| MoSPI's publications listing | read 15 October 2026 | No monthly review after the one for January 2026 |
| The roads cards on the dashboard | 16 October 2026 | No card sets construction against a target |
Each row names a document that this brief opened, and what that document shows about targets.
Source: PIB, MoSPI release launching the dashboard, 16 April 2026 ; MoSPI, monthly review of key infrastructure sectors for January 2026 ; MoSPI, publications and reports listing, 15 October 2026 ; MoSPI, PAIMANA Performance Monitoring Dashboard, roads, 16 October 2026 .
Every card this brief uses
Each card on the dashboard covers its own period, so this brief names the period in every sentence that gives a figure, and the table below lists every card the brief uses.
| Sector | Card | Period | Level | Change |
|---|---|---|---|---|
| Civil aviation | Revenue passenger kilometres | FY 2026-27 up to August | 10,609 crore passenger km | 8.8 per cent lower than a year earlier |
| Civil aviation | Tonne kilometres performed | FY 2026-27 up to August | 1,093.2 crore tonne km | 8.1 per cent lower than a year earlier |
| Civil aviation | Aircraft kilometres flown, scheduled revenue flights | FY 2026-27 up to August | 65.9 crore km | 7.9 per cent lower than a year earlier |
| Civil aviation | Hours flown | FY 2026-27 up to August | 12,01,128 hours | 7.5 per cent lower than a year earlier |
| Civil aviation | Available seat kilometres | FY 2026-27 up to August | 13,191.8 crore seat km | 6.4 per cent lower than a year earlier |
| Civil aviation | Departures | FY 2026-27 up to August | 5,35,314 departures | 5.3 per cent lower than a year earlier |
| Civil aviation | Available tonne kilometres | FY 2026-27 up to August | 1,490.5 crore tonne km | 4.7 per cent lower than a year earlier |
| Civil aviation | Passengers carried | FY 2026-27 up to August | 7.87 crore passengers | 4.6 per cent lower than a year earlier |
| Civil aviation | Aircraft movements at airports | FY 2026-27 up to August | 11.6 lakh movements | 3 per cent lower than a year earlier |
| Civil aviation | Passengers handled at airports | FY 2026-27 up to August | 16.6 crore passengers | 2.4 per cent lower than a year earlier |
| Railways | Track works, km | FY 2024-25 | 10,099 km | 10.3 per cent lower than a year earlier |
| Railways | Net tonne kilometres per wagon per day | FY 2024-25 | 7,292 net tonne km per wagon per day | 7.1 per cent lower than a year earlier |
| Railways | Average speed of goods trains | FY 2024-25 | 23.4 km per hour | 6.4 per cent lower than a year earlier |
| Railways | Goods wagon kilometres | FY 2024-25 | 22,841 million wagon km | 4.7 per cent lower than a year earlier |
| Railways | Diesel engine kilometres per engine failure | FY 2024-25 | 197,458 km per engine failure | 3.7 per cent lower than a year earlier |
| Railways | Days for a wagon to turn round | FY 2024-25 | 5.5 days | 7.2 per cent higher than a year earlier |
| Railways | Energy used by goods trains | FY 2024-25 | 6.5 units of energy per 1,000 gross tonne km | 4.5 per cent higher than a year earlier |
| Railways | Compensation claims received | FY 2024-25 | 3,732 claims | 20.3 per cent higher than a year earlier |
| Railways | Compensation claims paid | FY 2024-25 | 78 claims | 48.3 per cent lower than a year earlier |
| Railways | Gross compensation paid | FY 2024-25 | ₹4.98 crore | 38.0 per cent lower than a year earlier |
| Roads | National Highways constructed | FY 2026-27 up to September | 2,369.46 km of National Highways constructed, linear length | 18.6 per cent lower than a year earlier |
| Roads | Roads ministry's actual capital expenditure | FY 2026-27 up to September | ₹1,58,998 crore | 5.8 per cent lower than a year earlier |
| Roads | Electronic toll collections | FY 2026-27 up to September | ₹36,994.45 crore | 11.7 per cent higher than a year earlier |
| Roads | Electronic toll transactions | FY 2026-27 up to September | 225.24 crore electronic toll transactions | 24.1 per cent higher than a year earlier |
| Power | Interruptions of supply per customer, outside agriculture | FY 2025-26 | 5 per cent higher than a year earlier | |
| Power | Average duration of interruptions, outside agriculture | FY 2025-26 (Feb, 2026) | 35.2 per cent higher than a year earlier | |
| Ports, shipping and waterways | Passenger traffic at major ports | FY 2024-25 | 5,85,900 passengers | 7.9 per cent lower than a year earlier |
| Ports, shipping and waterways | People employed at major and non-major ports | calendar year 2025 | 27,144 persons | 9.7 per cent lower than a year earlier |
Source: MoSPI, PAIMANA Performance Monitoring Dashboard, as saved on 16 October 2026 .
Terms, explained
- PAIMANA dashboard
- MoSPI's Performance Monitoring Dashboard of the infrastructure sector, which shows a set of cards for six sectors and is updated each quarter. MoSPI overwrites it in place.
- Card
- One measure on the dashboard, such as the length of National Highways constructed, with its level, its change against a year earlier and the period it covers.
- Period
- The months or the year that a card covers. Cards in different sectors cover different periods, so each figure in this brief names its own.
- Than a year earlier
- The change a card prints against the same period a year before. It says nothing about any earlier year.
- Indian scheduled airlines
- The Indian scheduled operators whose services the Directorate General of Civil Aviation's cards cover. Foreign airlines are not counted on those cards.
- Revenue passenger kilometres
- The paying passengers on each flight stage multiplied by the stage's distance, added up.
- Available seat kilometres
- The seats offered for sale on each flight stage multiplied by the stage's distance, added up.
- Net tonne kilometres per wagon per day
- The freight each broad gauge wagon carries, multiplied by the distance, for each day, which measures how much work each wagon does.
- Wagon turn-round
- The days a broad gauge wagon takes from one loading to the next.
- Interruptions per customer
- The average number of times that supply to a consumer is interrupted in the period.
Downloads for readers and the press
Sources & method
Every figure in this brief is a card on MoSPI's PAIMANA Performance Monitoring Dashboard of the infrastructure sector, as the dashboard stood at 16:04 IST on 16 October 2026, minutes after its quarterly update of that day. MoSPI overwrites the dashboard in place, so the figures were read from a copy saved at that moment.
Each card gives a level, a change against a year earlier and the period it covers. Each figure in this brief carries its own card's period, because the periods differ from sector to sector.
A change is repeated exactly as the card prints it, as a per cent against the same period a year earlier, and it says nothing about any year before that one.
Cards are set side by side only when they share a period, and nothing in this brief says that one card caused another.
Each figure was read from the saved copy by one reader and read again by a second, and it is printed exactly as the card prints it. Each card names the ministry or body that supplied it, and this brief names it too.
- MoSPI, PAIMANA Performance Monitoring Dashboard, civil aviation, 16 October 2026 .
- MoSPI, PAIMANA Performance Monitoring Dashboard, railways, 16 October 2026 .
- MoSPI, PAIMANA Performance Monitoring Dashboard, roads, 16 October 2026 .
- MoSPI, PAIMANA Performance Monitoring Dashboard, power, 16 October 2026 .
- MoSPI, PAIMANA Performance Monitoring Dashboard, ports, shipping and waterways, 16 October 2026 .
- PIB, MoSPI release launching the dashboard, 16 April 2026 .
- MoSPI, monthly review of key infrastructure sectors for January 2026 .
- MoSPI, publications and reports listing, 15 October 2026 .