The record
Its highest in those ten years was 2.74 per cent, in 2018-19.
In manufacturing, on MoSPI's 2011-12 series at current prices, private companies put 3.18 per cent of GDP in 2023-24, against 4.58 per cent in 2011-12, and in none of the ten years from 2014-15 did that share come back to that level.
Source: MoSPI national accounts, base 2011-12, via CMIE Economic Outlook, report 98762, for every year ; MoSPI, National Accounts Statistics 2024, Statement 7.2B, which prints the same figures for 2011-12 to 2021-22 ; Economic Survey 2025-26, Table 1.8 ; MoSPI national accounts via CMIE Economic Outlook, report 98765 ; Economic Survey 2025-26, Table 1.7 .
The eight findings
This brief asks whether private companies now put as large a share of the economy into power, transport, storage and communication as they did in 2011-12, and whether the same holds in manufacturing. The figures come from the Government's own national accounts and Economic Survey, from CMIE's database of projects and from the World Bank.
1. Power, transport, storage and communication
On MoSPI's 2011-12 series, at current prices, in none of the ten years from 2014-15 to 2023-24 did private companies put as large a share of GDP into power, transport, storage and communication as they did in 2011-12. It was 2.78 per cent of GDP in 2011-12 and 2.26 per cent in 2023-24.
Source: MoSPI national accounts, base 2011-12, via CMIE Economic Outlook, report 98762, for every year ; MoSPI, National Accounts Statistics 2024, Statement 7.2B, which prints the same figures for 2011-12 to 2021-22 ; Economic Survey 2025-26, Table 1.8 ; MoSPI national accounts via CMIE Economic Outlook, report 98765 ; Economic Survey 2025-26, Table 1.7 .
2. The whole economy
On MoSPI's 2011-12 series, at current prices, fixed investment by private companies and households together was 27.0 per cent of GDP in 2011-12 and 22.8 per cent in 2023-24.
Source: Economic Survey 2025-26, Table 1.8 .
3. All owners together
On MoSPI's 2011-12 series, at current prices, investment in power, transport, storage and communication by the public sector, private companies and households together was 6.37 per cent of GDP in 2011-12. It has not reached that level in any year since, and it was 5.82 per cent in 2023-24.
Source: MoSPI, National Accounts Statistics 2025, Statement 7.2 ; MoSPI, National Accounts Statistics 2025, Statement 7.2A ; MoSPI national accounts via CMIE Economic Outlook, report 98750 ; MoSPI national accounts, base 2011-12, via CMIE Economic Outlook, report 98762, for every year ; MoSPI national accounts via CMIE Economic Outlook, report 98774 ; Economic Survey 2025-26, Table 1.8 .
4. Roads
On the Survey's own chart, which counts the Budget's outlay and private investment but not the National Highways Authority's borrowing, private investment in roads was ₹0.19 lakh crore in 2014-15 and ₹0.35 lakh crore in 2023-24, while the Budget's outlay rose from ₹0.25 lakh crore to ₹2.65 lakh crore. The private share fell from about 43 per cent to about 12 per cent.
Source: Economic Survey 2023-24, Chart XII.10 ; Notes on Demands for Grants 2024-25, Demand 86 ; Notes on Demands for Grants 2025-26, Demand 86 ; Interim Budget 2024-25, Expenditure Profile, Statement 27 .
5. Projects being built
The private sector's share of all investment projects under implementation fell from 55.4 per cent at the end of March 2012 to 38.9 per cent at the end of March 2026.
Source: CMIE CapEx database via CMIE Economic Outlook .
6. Transport partnerships
Investment committed to transport projects with private participation in India was US$22.0 billion in 2012. In the ten years from 2015 to 2024 it never exceeded US$9.3 billion, and it was US$1.2 billion in 2024.
Source: World Bank, World Development Indicators, IE.PPI.TRAN.CD .
7. The record before 2014
On MoSPI's 1999-2000 base, the private sector's share, with households, of investment in power, transport, storage and communication rose from 25.9 per cent in 1990-91 to 61.5 per cent in 2007-08. On the 2004-05 base it was 58.4 per cent in 2011-12, the highest in that series, which runs from 1960-61.
Source: MoSPI, Back Series 2007, Statement 13 ; MoSPI, Back Series 2007, Statement 22 ; MoSPI, National Accounts Statistics 2009, Statement 20 ; MoSPI, National Accounts Statistics 2009, Statement 31 ; MoSPI back series via CMIE Economic Outlook, reports 112664 to 112686 .
8. Manufacturing
On MoSPI's 2011-12 series, at current prices, private companies put 4.58 per cent of GDP into manufacturing in 2011-12 and 3.18 per cent in 2023-24. In none of the ten years from 2014-15 to 2023-24 did it come back to the 2011-12 level: its highest in those years was 4.21 per cent, in 2015-16.
Source: MoSPI national accounts, base 2011-12, via CMIE Economic Outlook, report 98762, for every year ; MoSPI, National Accounts Statistics 2024, Statement 7.2B, which prints the same figures for 2011-12 to 2021-22 ; Economic Survey 2025-26, Table 1.8 .
1. Private companies' investment in infrastructure has not returned to its 2011-12 share of GDP at current prices
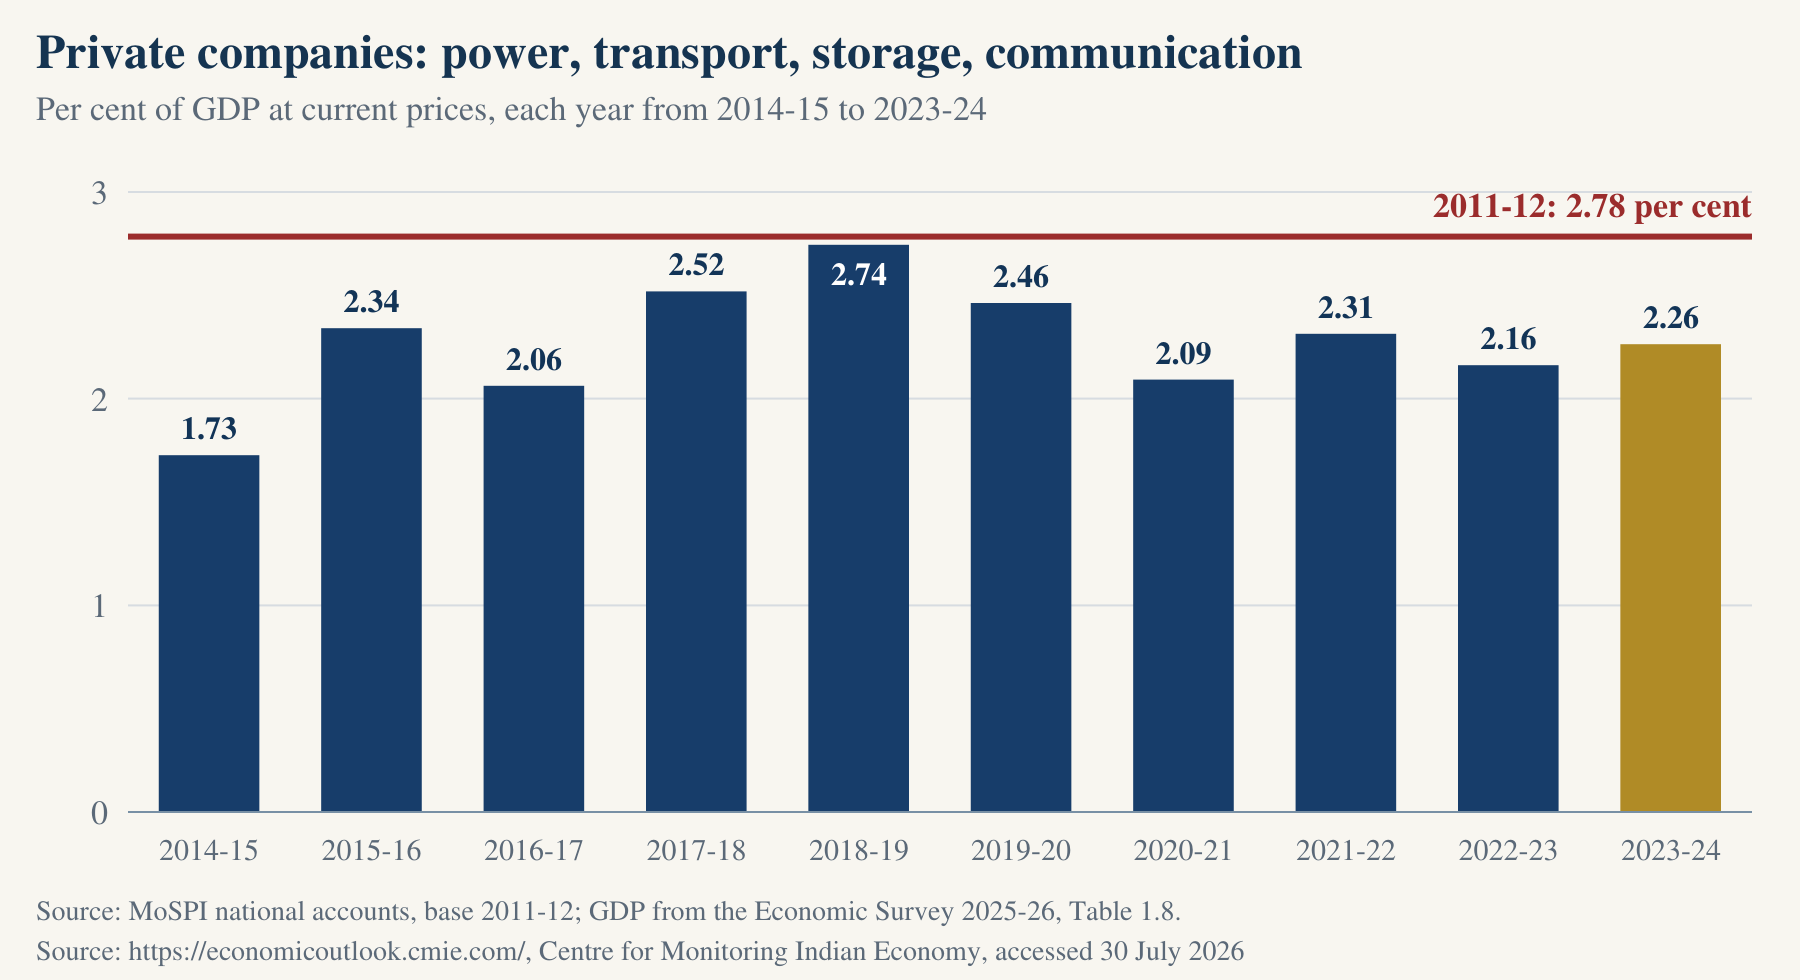
On MoSPI's 2011-12 series, at current prices, in none of the ten years from 2014-15 to 2023-24 did private companies put as large a share of GDP into power, transport, storage and communication as they did in 2011-12. It was 2.78 per cent of GDP in 2011-12 and 2.26 per cent in 2023-24.
Its highest in those ten years was 2.74 per cent, in 2018-19.
On MoSPI's 2011-12 series, at current prices, in electricity, gas, water supply and other utility services, their share of GDP was 1.70 per cent in 2011-12 and 0.71 per cent in 2023-24, and in none of those ten years did it reach even its 2013-14 level of 1.22 per cent. Measured at constant 2011-12 prices, the same share was 0.91 per cent in 2023-24, and in none of those ten years did it reach its 2013-14 level of 1.34 per cent either.
This means that, at current prices, private companies put a smaller share of GDP into these industries in every year of the decade from 2014-15 to 2023-24 than they did in 2011-12.
For the electricity figures at constant 2011-12 prices: MoSPI national accounts via CMIE Economic Outlook, report 98765, accessed 30 July 2026; GDP from Economic Survey 2025-26, Table 1.7, column (10).
Source: MoSPI national accounts, base 2011-12, via CMIE Economic Outlook, report 98762, for every year ; MoSPI, National Accounts Statistics 2024, Statement 7.2B, which prints the same figures for 2011-12 to 2021-22 ; Economic Survey 2025-26, Table 1.8 ; MoSPI national accounts via CMIE Economic Outlook, report 98765 ; Economic Survey 2025-26, Table 1.7 .
The industries counted are electricity, gas, water supply and other utilities; railways; transport by other means; storage; and communication. GDP is the Economic Survey's own figure for each year.
View the figures in a table
| Year or item | Value | Source |
|---|---|---|
| 2014-15 | 1.73 | MoSPI, NAS 2024, Statement 7.2B |
| 2015-16 | 2.34 | MoSPI, NAS 2024, Statement 7.2B |
| 2016-17 | 2.06 | MoSPI, NAS 2024, Statement 7.2B |
| 2017-18 | 2.52 | MoSPI, NAS 2024, Statement 7.2B |
| 2018-19 | 2.74 | MoSPI, NAS 2024, Statement 7.2B |
| 2019-20 | 2.46 | MoSPI, NAS 2024, Statement 7.2B |
| 2020-21 | 2.09 | MoSPI, NAS 2024, Statement 7.2B |
| 2021-22 | 2.31 | MoSPI, NAS 2024, Statement 7.2B |
| 2022-23 | 2.16 | On MoSPI's 2011-12 series, at current prices, via CMIE report 98762 |
| 2023-24 | 2.26 | On MoSPI's 2011-12 series, at current prices, via CMIE report 98762 |
2. Fixed investment by private companies and households fell from 27.0 to 22.8 per cent of GDP at current prices, 2011-12 to 2023-24, on MoSPI's 2011-12 series
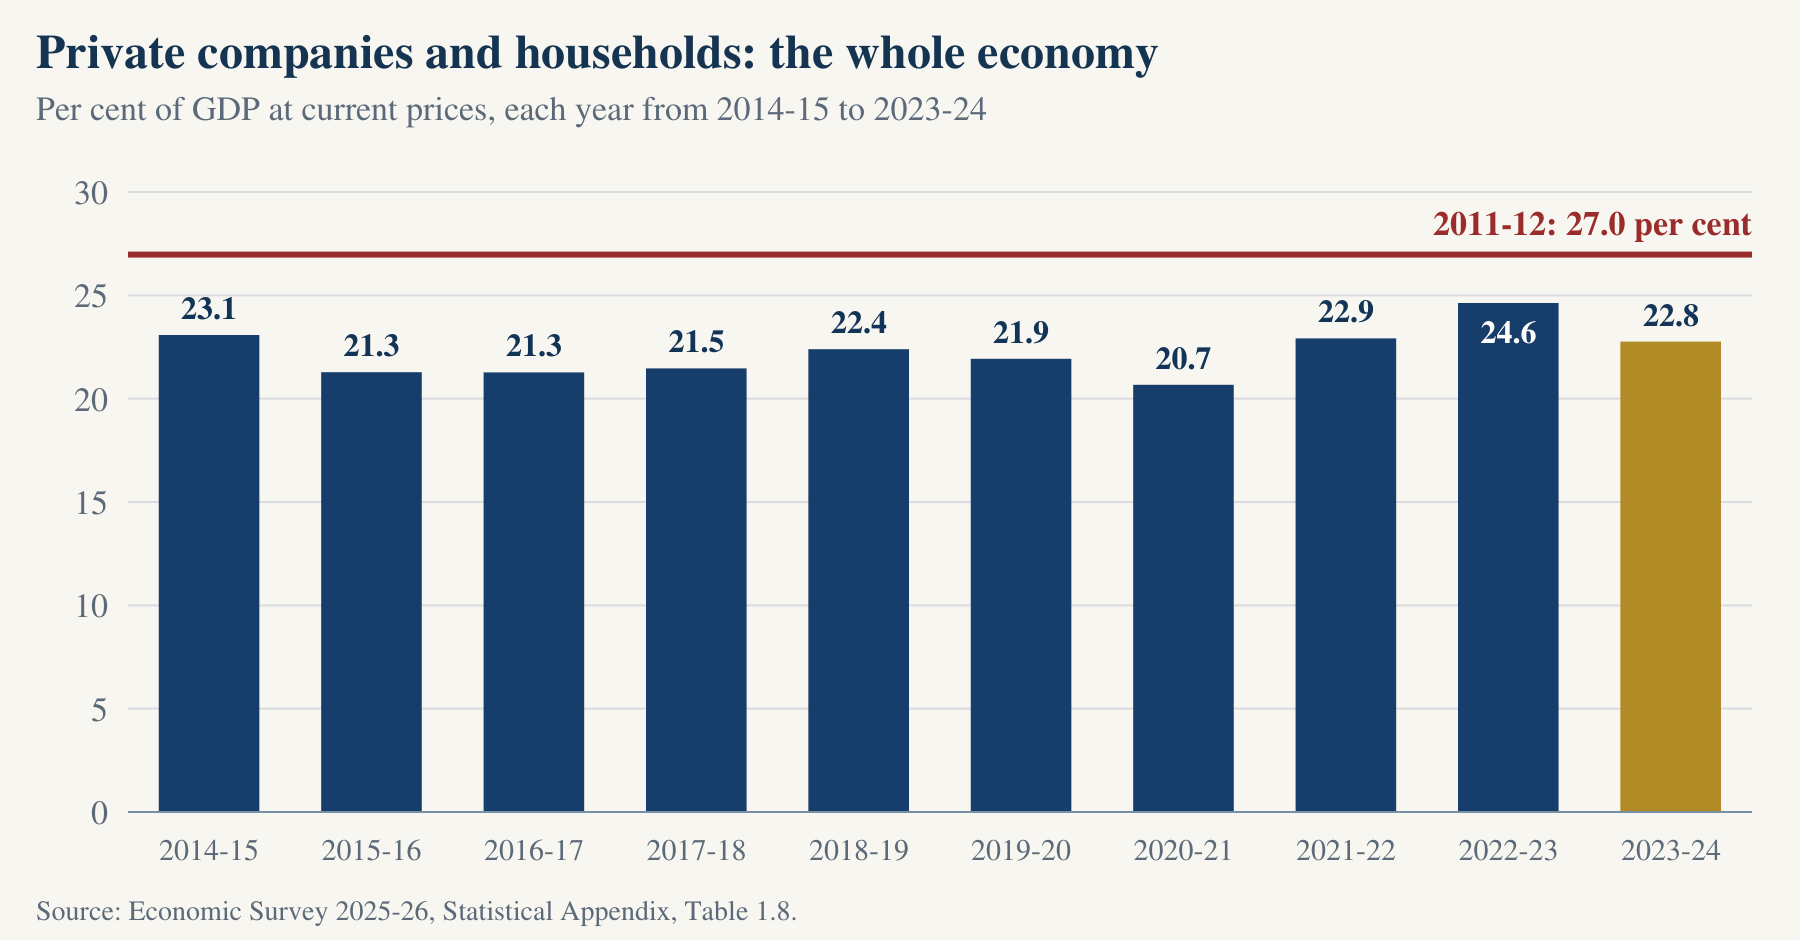
On MoSPI's 2011-12 series, at current prices, fixed investment by private companies and households together was 27.0 per cent of GDP in 2011-12 and 22.8 per cent in 2023-24.
It had been 27.5 per cent in 2007-08.
This means that for every ₹100 of GDP, private companies and households together invested about ₹4 less in fixed assets in 2023-24 than in 2011-12. The figures are the National Statistical Office's, as printed in the Ministry of Finance's own Economic Survey.
Source: Economic Survey 2025-26, Table 1.8 .
The table is the Economic Survey's Table 1.8, "Gross Domestic Saving and Gross Capital Formation (at current prices)", 2011-12 series. Its private sector column includes households. The 2023-24 figure is the 2011-12 series' first revised estimate, the last year that series gives.
View the figures in a table
| Year or item | Value | Source |
|---|---|---|
| 2014-15 | 23.1 | Economic Survey 2025-26, Table 1.8, columns (7) and (18) |
| 2015-16 | 21.3 | Economic Survey 2025-26, Table 1.8, columns (7) and (18) |
| 2016-17 | 21.3 | Economic Survey 2025-26, Table 1.8, columns (7) and (18) |
| 2017-18 | 21.5 | Economic Survey 2025-26, Table 1.8, columns (7) and (18) |
| 2018-19 | 22.4 | Economic Survey 2025-26, Table 1.8, columns (7) and (18) |
| 2019-20 | 21.9 | Economic Survey 2025-26, Table 1.8, columns (7) and (18) |
| 2020-21 | 20.7 | Economic Survey 2025-26, Table 1.8, columns (7) and (18) |
| 2021-22 | 22.9 | Economic Survey 2025-26, Table 1.8, columns (7) and (18) |
| 2022-23 | 24.6 | Economic Survey 2025-26, Table 1.8, columns (7) and (18) |
| 2023-24 | 22.8 | Economic Survey 2025-26, Table 1.8, columns (7) and (18) |
3. Investment in power, transport, storage and communication is still below its 2011-12 share of GDP at current prices
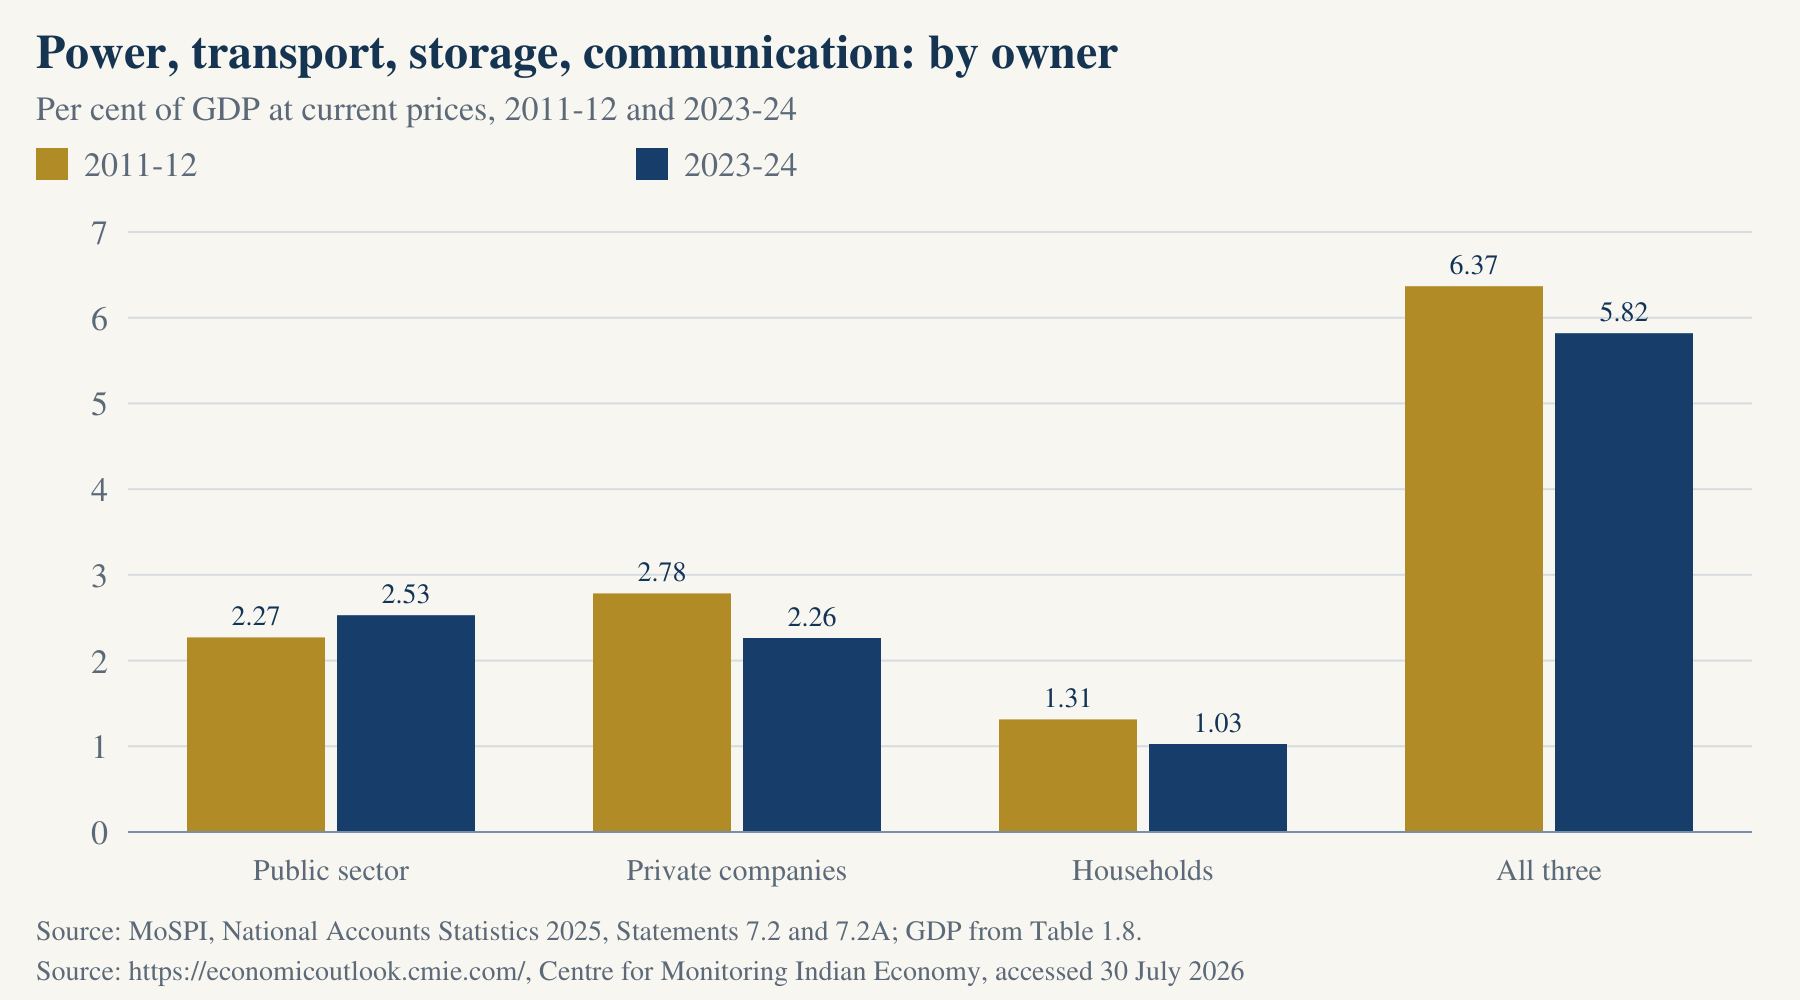
On MoSPI's 2011-12 series, at current prices, investment in power, transport, storage and communication by the public sector, private companies and households together was 6.37 per cent of GDP in 2011-12. It has not reached that level in any year since, and it was 5.82 per cent in 2023-24.
Its highest after 2011-12 was 6.16 per cent, in 2018-19.
This means that in these industries, at current prices, the public sector's investment rose by 0.26 points of GDP between 2011-12 and 2023-24, while that of private companies and households together fell by 0.81 points, so the country as a whole puts a smaller share of its GDP into them than in 2011-12.
Source: MoSPI, National Accounts Statistics 2025, Statement 7.2 ; MoSPI, National Accounts Statistics 2025, Statement 7.2A ; MoSPI national accounts via CMIE Economic Outlook, report 98750 ; MoSPI national accounts, base 2011-12, via CMIE Economic Outlook, report 98762, for every year ; MoSPI national accounts via CMIE Economic Outlook, report 98774 ; Economic Survey 2025-26, Table 1.8 .
These industries do not include roads built by government departments, irrigation or urban works, which the national accounts record largely under public administration.
View the figures in a table
| Year or item | Value | Source |
|---|---|---|
| Public sector | 2.53 | On MoSPI's 2011-12 series, at current prices, NAS 2025, Statement 7.2A |
| Private companies | 2.26 | On MoSPI's 2011-12 series, at current prices, via CMIE report 98762 |
| Households | 1.03 | On MoSPI's 2011-12 series, at current prices, via CMIE report 98774 |
| All three | 5.82 | On MoSPI's 2011-12 series, at current prices, NAS 2025, Statement 7.2 |
4. Roads: the Government's own Survey shows the private share shrinking
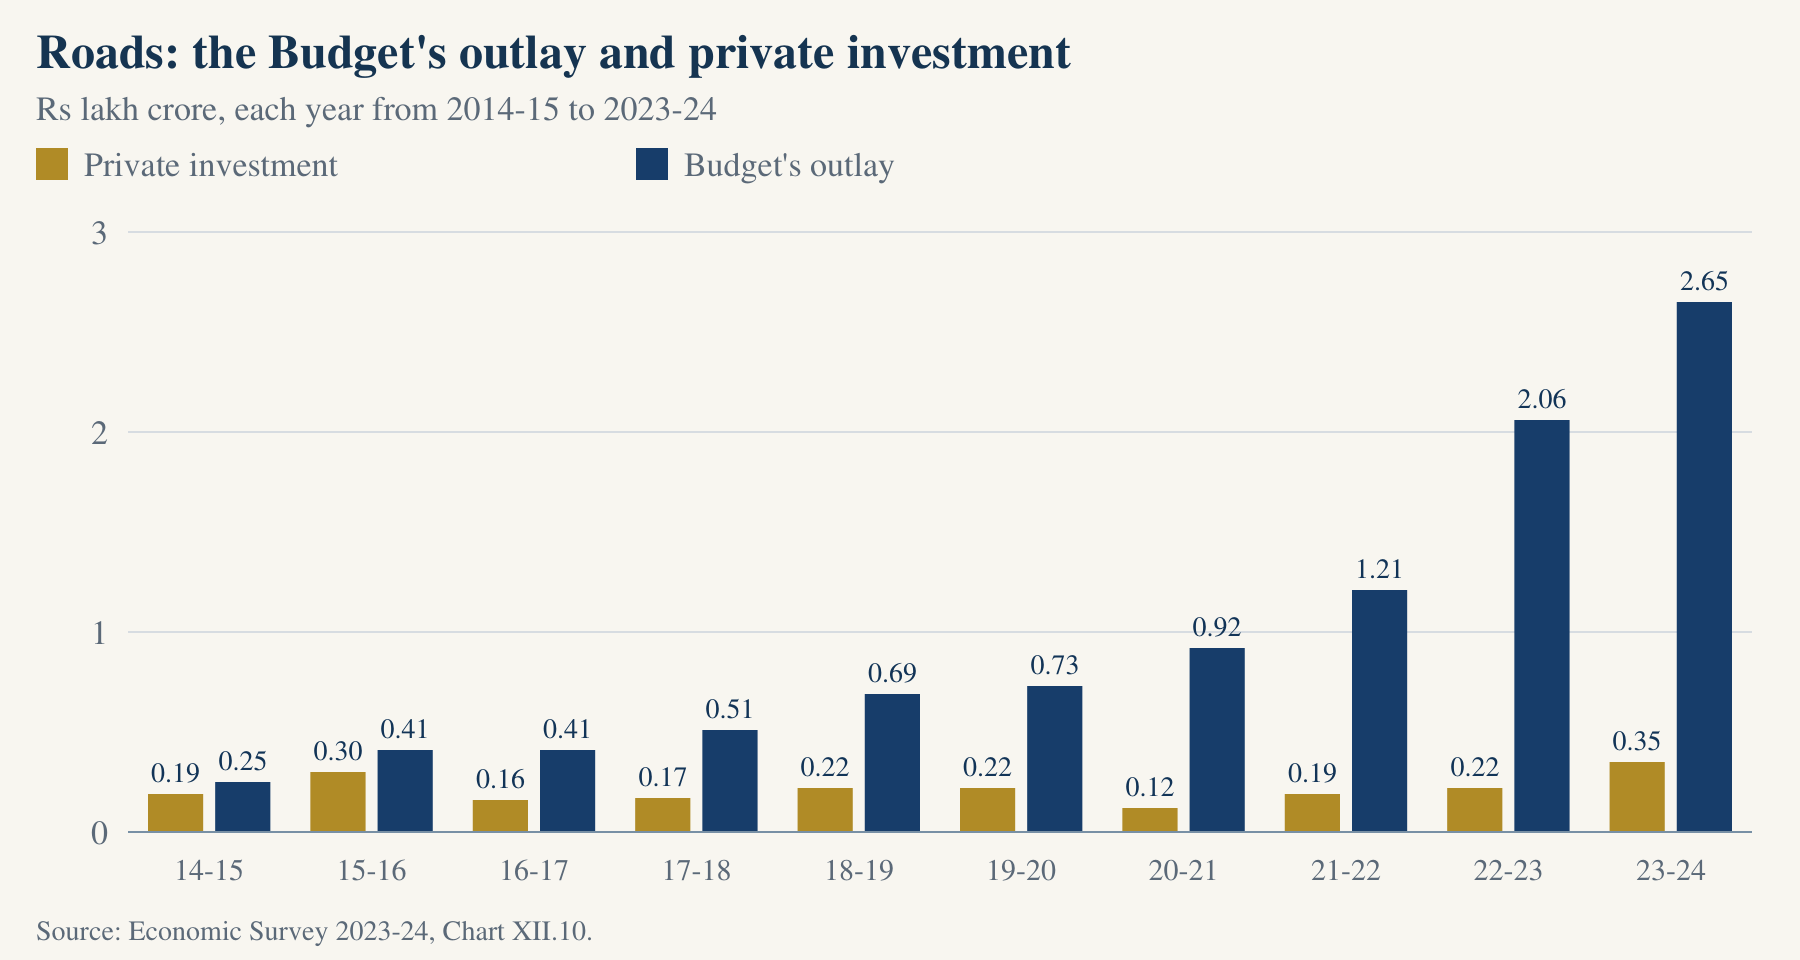
On the Survey's own chart, which counts the Budget's outlay and private investment but not the National Highways Authority's borrowing, private investment in roads was ₹0.19 lakh crore in 2014-15 and ₹0.35 lakh crore in 2023-24, while the Budget's outlay rose from ₹0.25 lakh crore to ₹2.65 lakh crore. The private share fell from about 43 per cent to about 12 per cent.
This means that the road programme now rests almost wholly on the public purse: of every ₹100 that the Budget and private investors put into roads in 2023-24, ₹88 came from the Budget, on the revised estimate and on the later actual alike.
Source: Economic Survey 2023-24, Chart XII.10 ; Notes on Demands for Grants 2024-25, Demand 86 ; Notes on Demands for Grants 2025-26, Demand 86 ; Interim Budget 2024-25, Expenditure Profile, Statement 27 .
The chart is the Economic Survey 2023-24's Chart XII.10, which is titled "Total capital outlay for investment in road transport". Its own source line reads "Union Budget Documents, Inputs Received from Ministry of Road Transport and Highways". The shares are worked out from the chart's three columns.
The chart's 2023-24 bar is the revised estimate of the Ministry's net capital, which the Notes on Demands for Grants 2024-25 print under Demand 86. The actual, which the Notes on Demands 2025-26 print, gives the same shares. The Interim Budget 2024-25 records that "In FY 2023-24, NHAI has not been permitted to borrow" (Expenditure Profile, Statement 27). The 2014-15 bar is the Ministry's total Plan spending, so the start year's share is given as "about".
View the figures in a table
| Year or item | Value | Source |
|---|---|---|
| 2014-15 | 0.19 | Economic Survey 2023-24, Chart XII.10 |
| 2015-16 | 0.30 | Economic Survey 2023-24, Chart XII.10 |
| 2016-17 | 0.16 | Economic Survey 2023-24, Chart XII.10 |
| 2017-18 | 0.17 | Economic Survey 2023-24, Chart XII.10 |
| 2018-19 | 0.22 | Economic Survey 2023-24, Chart XII.10 |
| 2019-20 | 0.22 | Economic Survey 2023-24, Chart XII.10 |
| 2020-21 | 0.12 | Economic Survey 2023-24, Chart XII.10 |
| 2021-22 | 0.19 | Economic Survey 2023-24, Chart XII.10 |
| 2022-23 | 0.22 | Economic Survey 2023-24, Chart XII.10 |
| 2023-24 | 0.35 | Economic Survey 2023-24, Chart XII.10 |
5. Private companies' share of the projects being built fell from 55 to 39 per cent
The private sector's share of all investment projects under implementation fell from 55.4 per cent at the end of March 2012 to 38.9 per cent at the end of March 2026.
In rupees, the private sector's projects under implementation were smaller at the end of March 2020, at ₹38.00 lakh crore, than at the end of March 2012, at ₹46.93 lakh crore.
This means that of every ₹100 of projects under construction in March 2026, private companies held ₹39, against ₹55 in March 2012.
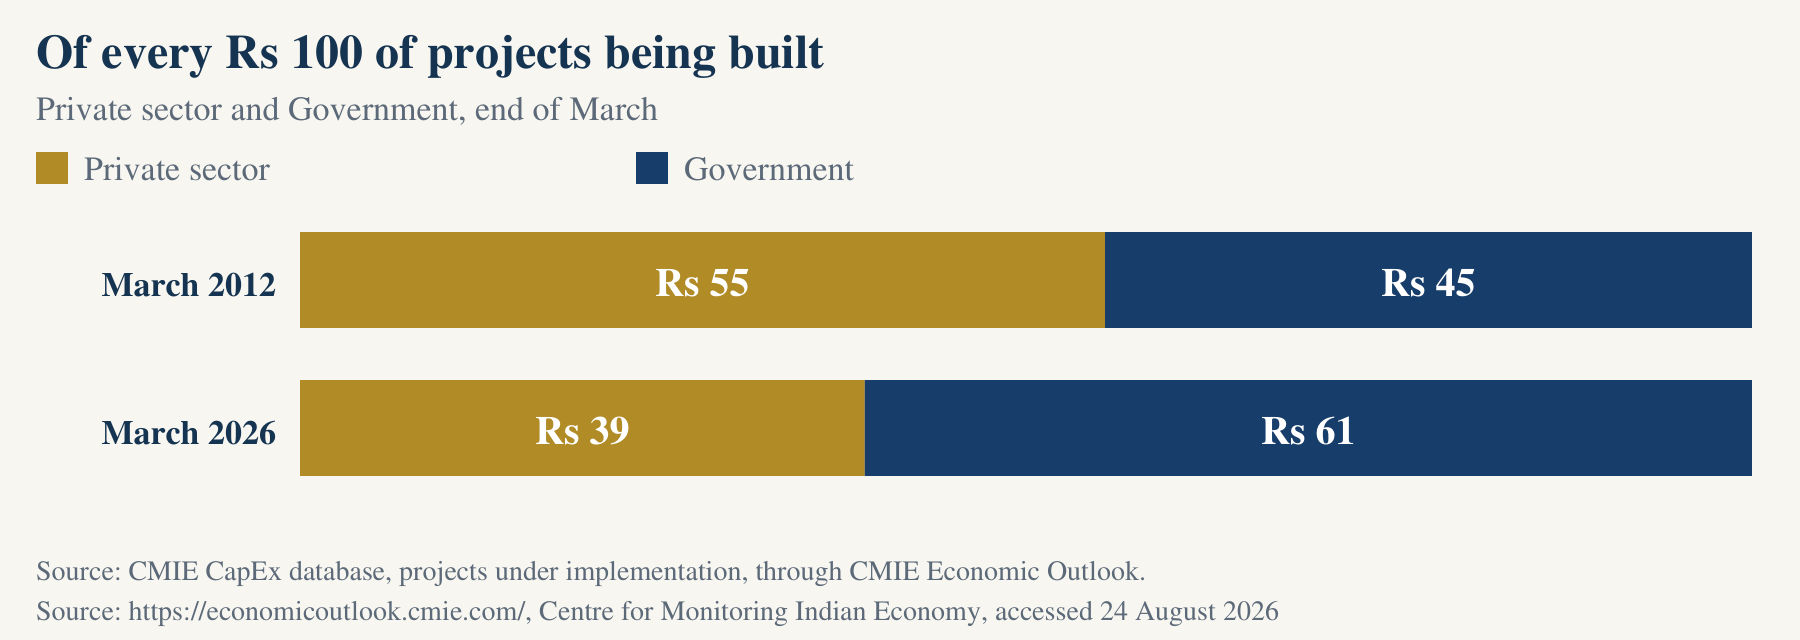
Source: CMIE CapEx database via CMIE Economic Outlook .
The source is CMIE's CapEx database, "Investment projects under implementation: Value", for the Government and the private sector, through CMIE Economic Outlook (indicators 340558 and 340589). A project's value is its total cost while it is being built, so this measures the stock of projects in hand, not one year's spending.
View the figures in a table
| Year or item | Value | Source |
|---|---|---|
| March 2012 | 55 | CMIE indicators 340589 and 340558 |
| March 2026 | 39 | CMIE indicators 340589 and 340558 |
6. Private participation in transport has not recovered in ten years
Investment committed to transport projects with private participation in India was US$22.0 billion in 2012. In the ten years from 2015 to 2024 it never exceeded US$9.3 billion, and it was US$1.2 billion in 2024.
This means that in a full decade, measured in US dollars, the transport projects which the public-private partnership model was built to attract have not come back to even half of their 2012 level.
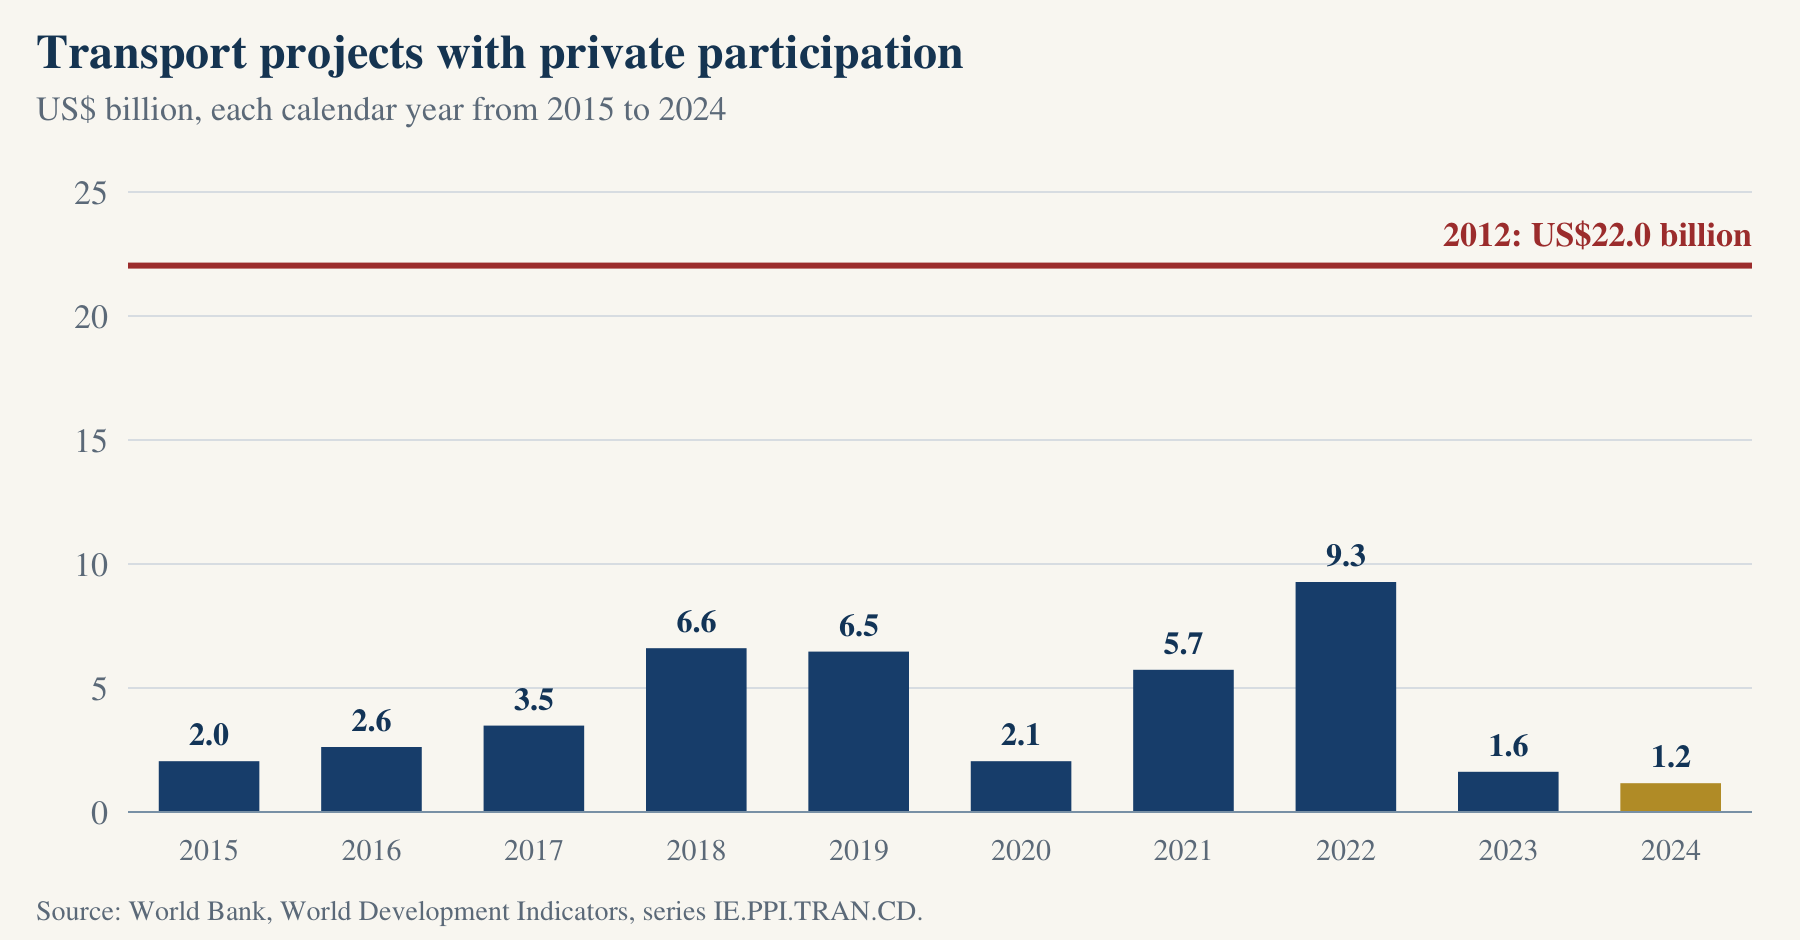
Source: World Bank, World Development Indicators, IE.PPI.TRAN.CD .
The series is the one that the World Bank names "Investment in transport with private participation (current US$)". It comes from the Private Participation in Infrastructure database, and it is kept by calendar year. It counts commitments when a project reaches financial closure. The figure is the total investment in each project that has a private partner.
View the figures in a table
| Year or item | Value | Source |
|---|---|---|
| 2015 | 2.0 | World Bank WDI, IE.PPI.TRAN.CD |
| 2016 | 2.6 | World Bank WDI, IE.PPI.TRAN.CD |
| 2017 | 3.5 | World Bank WDI, IE.PPI.TRAN.CD |
| 2018 | 6.6 | World Bank WDI, IE.PPI.TRAN.CD |
| 2019 | 6.5 | World Bank WDI, IE.PPI.TRAN.CD |
| 2020 | 2.1 | World Bank WDI, IE.PPI.TRAN.CD |
| 2021 | 5.7 | World Bank WDI, IE.PPI.TRAN.CD |
| 2022 | 9.3 | World Bank WDI, IE.PPI.TRAN.CD |
| 2023 | 1.6 | World Bank WDI, IE.PPI.TRAN.CD |
| 2024 | 1.2 | World Bank WDI, IE.PPI.TRAN.CD |
7. The record before 2014: private capital came into infrastructure
On MoSPI's 1999-2000 base, the private sector's share, with households, of investment in power, transport, storage and communication rose from 25.9 per cent in 1990-91 to 61.5 per cent in 2007-08. On the 2004-05 base it was 58.4 per cent in 2011-12, the highest in that series, which runs from 1960-61.
This means that in the two decades after 1991, private money came to carry more than half of the country's investment in these industries, on both bases that cover those years.
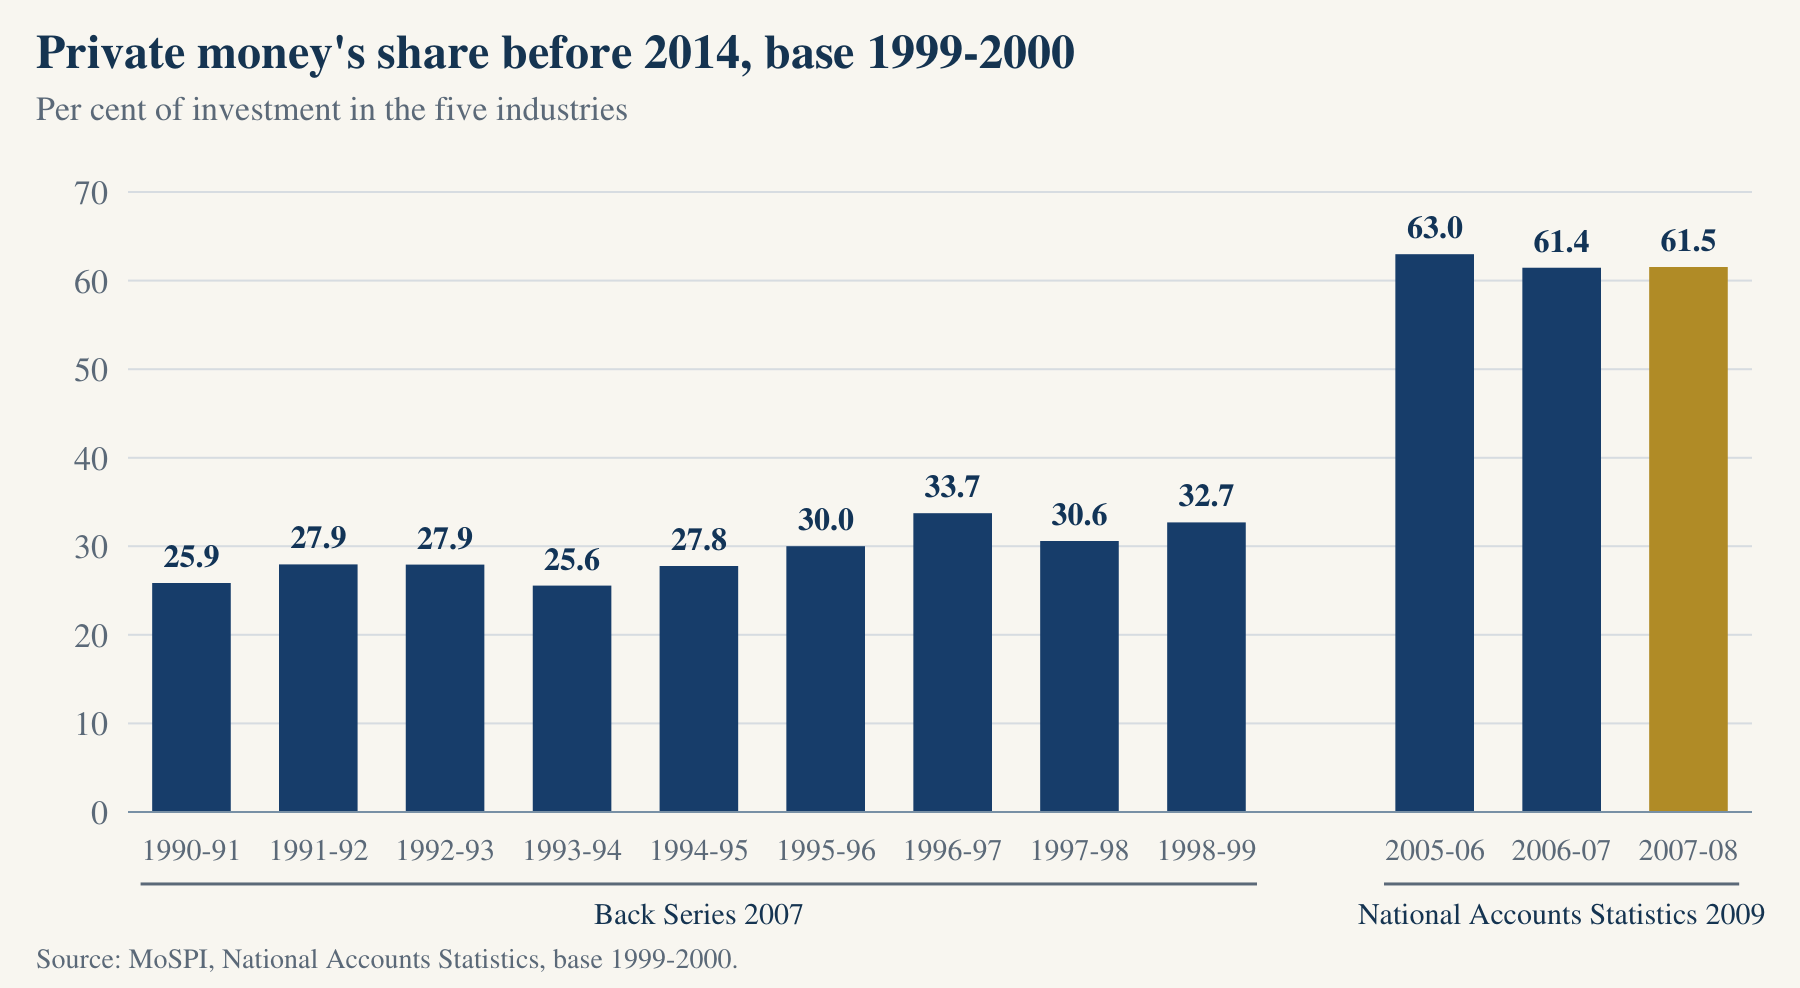
Source: MoSPI, Back Series 2007, Statement 13 ; MoSPI, Back Series 2007, Statement 22 ; MoSPI, National Accounts Statistics 2009, Statement 20 ; MoSPI, National Accounts Statistics 2009, Statement 31 ; MoSPI back series via CMIE Economic Outlook, reports 112664 to 112686 .
For 1990-91 the figures are MoSPI's Back Series 2007, Statement 13 (all institutions) and Statement 22 (public sector); for 2007-08 they are National Accounts Statistics 2009, Statement 20 (all institutions) and Statement 31 (public sector). The private share is all institutions minus the public sector, because no statement prints it. For 2011-12 the source is the 2004-05 base as reproduced by CMIE (reports 112664, 112672, 112678 and 112686). Each figure is labelled with its base, and none is compared with another base.
View the figures in a table
8. Private companies' investment in manufacturing has not returned to its 2011-12 share of GDP
On MoSPI's 2011-12 series, at current prices, private companies put 4.58 per cent of GDP into manufacturing in 2011-12 and 3.18 per cent in 2023-24. In none of the ten years from 2014-15 to 2023-24 did it come back to the 2011-12 level: its highest in those years was 4.21 per cent, in 2015-16.
This means that in 2023-24 private companies put 1.40 points of GDP less into manufacturing than they did in 2011-12. Over the same years, their investment in power, transport, storage and communication fell by 0.52 points of GDP, so the fall in manufacturing was more than twice as large.
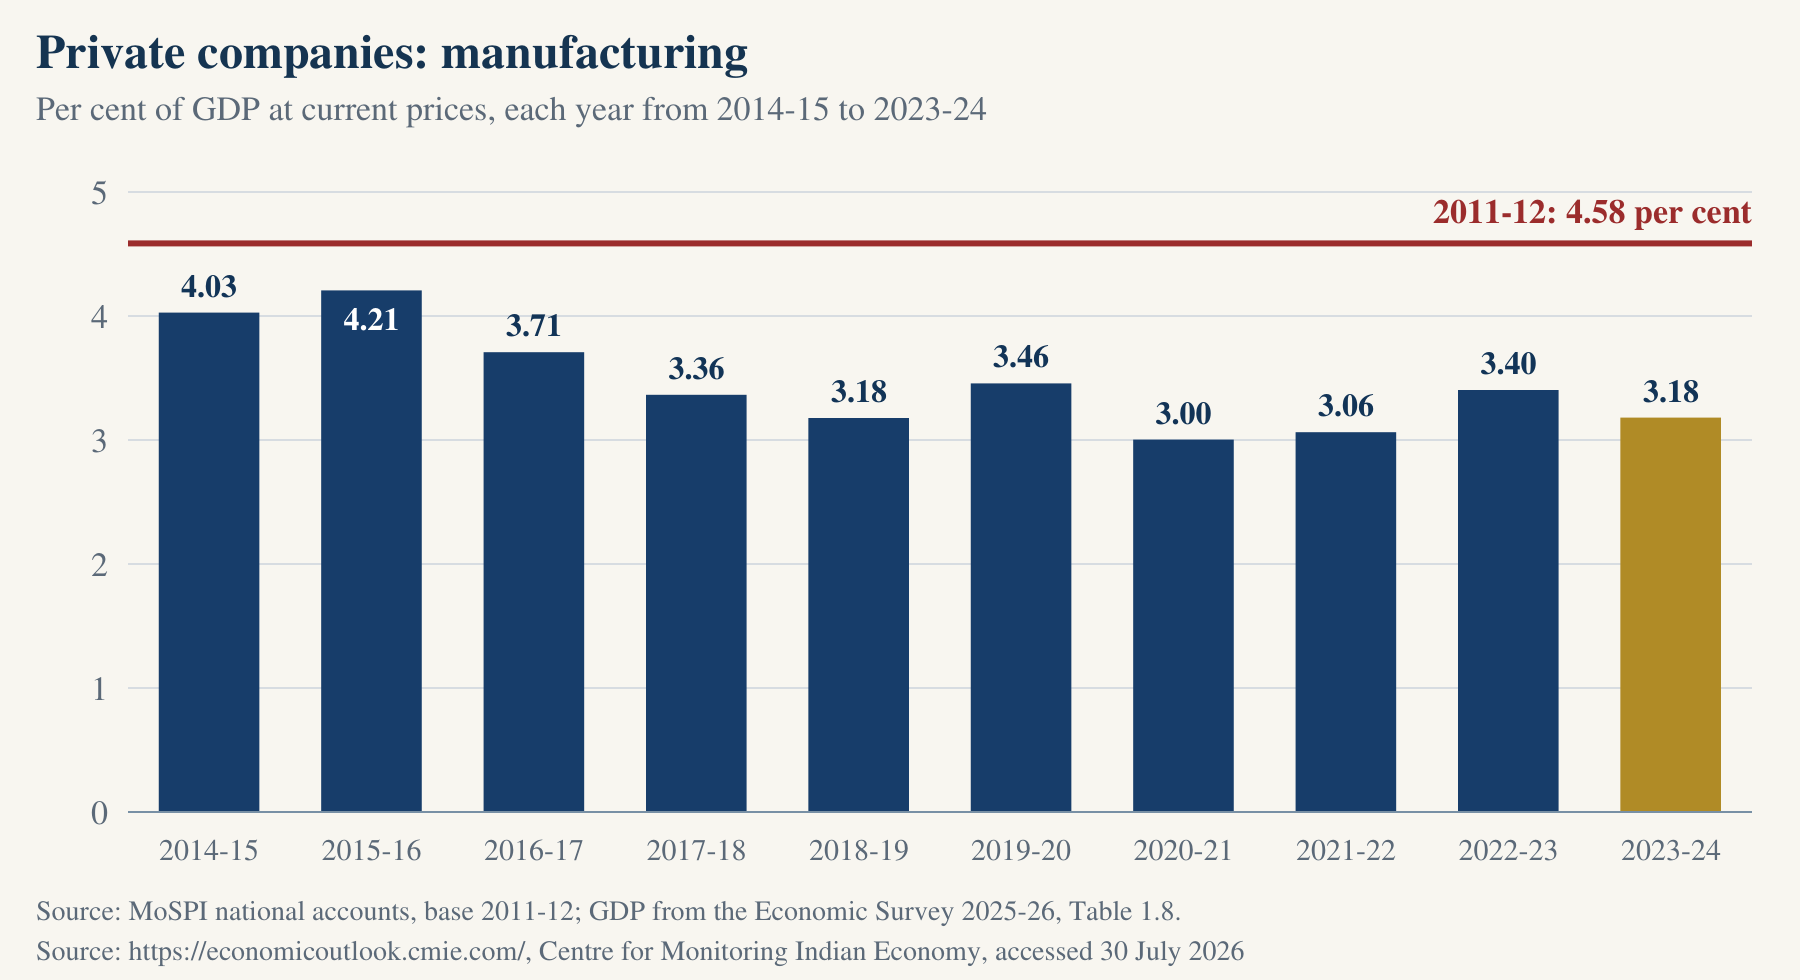
Source: MoSPI national accounts, base 2011-12, via CMIE Economic Outlook, report 98762, for every year ; MoSPI, National Accounts Statistics 2024, Statement 7.2B, which prints the same figures for 2011-12 to 2021-22 ; Economic Survey 2025-26, Table 1.8 .
The figures are MoSPI's national accounts for private corporations, base 2011-12, which give fixed investment by industry. Each is set against GDP from the Economic Survey 2025-26, Table 1.8, and both are at current prices. The 2023-24 figure is the 2011-12 series' first revised estimate.
View the figures in a table
| Year or item | Value | Source |
|---|---|---|
| 2014-15 | 4.03 | MoSPI, NAS 2024, Statement 7.2B |
| 2015-16 | 4.21 | MoSPI, NAS 2024, Statement 7.2B |
| 2016-17 | 3.71 | MoSPI, NAS 2024, Statement 7.2B |
| 2017-18 | 3.36 | MoSPI, NAS 2024, Statement 7.2B |
| 2018-19 | 3.18 | MoSPI, NAS 2024, Statement 7.2B |
| 2019-20 | 3.46 | MoSPI, NAS 2024, Statement 7.2B |
| 2020-21 | 3.00 | MoSPI, NAS 2024, Statement 7.2B |
| 2021-22 | 3.06 | MoSPI, NAS 2024, Statement 7.2B |
| 2022-23 | 3.40 | On MoSPI's 2011-12 series, at current prices, via CMIE report 98762 |
| 2023-24 | 3.18 | On MoSPI's 2011-12 series, at current prices, via CMIE report 98762 |
Of every ₹100
Of every ₹100 that the Budget and private investors put into roads in 2023-24, ₹88 came from the Budget. Of every ₹100 in projects being built, the private sector held ₹39 in March 2026, while it held ₹55 in March 2012.
Each card divides ₹100 between the public purse and private money, on the figures in this brief.
Source: Economic Survey 2023-24, Chart XII.10; CMIE CapEx database.
On MoSPI's 2011-12 series, at current prices, in each of the ten years from 2014-15 to 2023-24 private companies put a smaller share of GDP into power, transport, storage and communication, and into manufacturing, than they did in 2011-12.
Terms, explained
- GDP
- GDP means gross domestic product, the value of everything produced in a year. The brief uses GDP at current prices from Economic Survey 2025-26, Table 1.8, except for the electricity comparisons labelled “at constant 2011-12 prices”, which use GDP at those prices from Table 1.7.
- Fixed investment
- Spending on buildings, roads, power lines, machinery and other assets that last more than a year. The national accounts call it gross fixed capital formation.
- Private companies
- The private corporations of the national accounts, which are companies owned by private shareholders.
- Households
- Families and the small businesses they own, which the national accounts count as one sector.
- Public sector
- The Government at every level together with the enterprises it owns.
- Power, transport, storage and communication
- The national accounts' own industries: electricity, gas, water supply and other utilities; railways; transport by other means; storage; and communication.
- Projects under implementation
- CMIE's count of the total cost of every project that is being built on a date, so it is a stock of projects in hand and not one year's spending.
- Private participation
- The World Bank's measure of the investment committed to a project with a private partner, when the project reaches financial closure.
- Base year
- The year whose prices and coverage a series of national accounts is built on. A figure is compared only with figures on the same base.
Downloads for readers and the press
Sources & method
Each figure comes from a published table, which the page names. The page links that table, so readers can open it.
A share of GDP divides a year's investment by that year's GDP. The current-price figures use investment and GDP at current prices, with GDP from the Economic Survey's Table 1.8. The electricity comparisons labelled “at constant 2011-12 prices” use both investment and GDP at those prices, with GDP from Table 1.7.
The figures by industry and owner are MoSPI's national accounts, base 2011-12, as published in National Accounts Statistics and as reproduced in CMIE Economic Outlook.
On 27 February 2026 MoSPI released a new series of national accounts with base year 2022-23, which replaces the 2011-12 series and begins in 2022-23, and its National Accounts Statistics 2026, of 31 August 2026, updates it. A comparison with 2011-12 can be made only on the 2011-12 series, which runs to 2023-24, so every such comparison in this brief is made on that series.
Every figure is rounded once, from the unrounded result. A record claim is tested on every year's unrounded figure.
Points 1, 2, 3 and 8 compare years within one series, the 2011-12 series. Point 7 uses the 1999-2000 and 2004-05 bases. Each of its figures is labelled with its base, and none is compared with another base or with points 1 to 3.
- MoSPI national accounts, base 2011-12, via CMIE Economic Outlook, report 98762, for every year .
- MoSPI, National Accounts Statistics 2024, Statement 7.2B, which prints the same figures for 2011-12 to 2021-22 .
- Economic Survey 2025-26, Table 1.8 .
- MoSPI national accounts via CMIE Economic Outlook, report 98765 .
- Economic Survey 2025-26, Table 1.7 .
- MoSPI, National Accounts Statistics 2025, Statement 7.2 .
- MoSPI, National Accounts Statistics 2025, Statement 7.2A .
- MoSPI national accounts via CMIE Economic Outlook, report 98750 .
- MoSPI national accounts via CMIE Economic Outlook, report 98774 .
- Economic Survey 2023-24, Chart XII.10 .
- Notes on Demands for Grants 2024-25, Demand 86 .
- Notes on Demands for Grants 2025-26, Demand 86 .
- Interim Budget 2024-25, Expenditure Profile, Statement 27 .
- CMIE CapEx database via CMIE Economic Outlook .
- World Bank, World Development Indicators, IE.PPI.TRAN.CD .
- MoSPI, Back Series 2007, Statement 13 .
- MoSPI, Back Series 2007, Statement 22 .
- MoSPI, National Accounts Statistics 2009, Statement 20 .
- MoSPI, National Accounts Statistics 2009, Statement 31 .
- MoSPI back series via CMIE Economic Outlook, reports 112664 to 112686 .