The study
Of every 1,000 graduates in the labour force in 2025, 625 had no work or a job below graduate level. In 2017-18 the figure was 558, and in 2020-21 it was 587.
The share rose from 55.8 per cent in 2017-18 to 58.7 per cent in 2020-21.
Source: MoSPI, PLFS January to December 2025, unit-level data (microdata.gov.in catalogue 284) ; MoSPI, PLFS July 2020 to June 2021, unit-level data (microdata.gov.in catalogue 206) ; MoSPI, PLFS July 2017 to June 2018, unit-level data (microdata.gov.in catalogue 204) .
The essentials
This brief asks how many of India's graduates have no work, or work in a job below graduate level. MoSPI's own survey records answer that question, round by round, from 2017-18 to 2025.
In 2025, 62.5 per cent of graduates in India's labour force had no work, or worked in a job below graduate level, on MoSPI's own survey data. The share rose from 55.8 per cent in 2017-18 to 58.7 per cent in 2020-21.
Source: MoSPI, PLFS January to December 2025, unit-level data (microdata.gov.in catalogue 284) ; MoSPI, PLFS July 2020 to June 2021, unit-level data (microdata.gov.in catalogue 206) ; MoSPI, PLFS July 2017 to June 2018, unit-level data (microdata.gov.in catalogue 204) .
Six in ten
This share counts the graduates who had no work, together with those whose job was below graduate level. In 2025 it was 62.5 per cent. Between 2017-18 and 2020-21 it rose from 55.8 per cent to 58.7 per cent.
Source: MoSPI, PLFS July 2017 to June 2018, unit-level data (microdata.gov.in catalogue 204) ; MoSPI, PLFS July 2018 to June 2019, unit-level data (microdata.gov.in catalogue 216) ; MoSPI, PLFS July 2019 to June 2020, unit-level data (microdata.gov.in catalogue 217) ; and each round's catalogue, listed under Sources & method.
Of every 1,000 graduates
Of every 1,000 graduates in the labour force in 2025, 625 had no work or a job below graduate level. In 2017-18 the figure was 558, and in 2020-21 it was 587.
Source: MoSPI, PLFS July 2017 to June 2018, unit-level data (microdata.gov.in catalogue 204) ; MoSPI, PLFS July 2020 to June 2021, unit-level data (microdata.gov.in catalogue 206) ; MoSPI, PLFS January to December 2025, unit-level data (microdata.gov.in catalogue 284) .
Women and men graduates
In 2025 the share was 59.6 per cent for women graduates and 63.5 per cent for men graduates. For women it rose from 50.1 per cent in 2017-18 to 55.0 per cent in 2020-21, and for men from 57.2 per cent to 59.7 per cent over the same rounds.
Source: MoSPI, PLFS July 2017 to June 2018, unit-level data (microdata.gov.in catalogue 204) ; MoSPI, PLFS July 2018 to June 2019, unit-level data (microdata.gov.in catalogue 216) ; MoSPI, PLFS July 2019 to June 2020, unit-level data (microdata.gov.in catalogue 217) ; and each round's catalogue, listed under Sources & method.
The Government's own grouping
The Government's own Economic Survey 2024-25 groups these jobs the same way. Its footnote 110 lists the semi-skilled jobs, as follows: "Semi-skilled occupations include clerks, skilled agricultural and fisherman, plant and machine operators, assembly workers, craft and related trades workers, service workers, shop and market sales workers".
Source: Ministry of Finance, Economic Survey 2024-25, Chapter 12, Table XII.4 and footnote 110 .
Share of Unemployed and Underemployed Graduates
This share counts the graduates who had no work, together with those whose job was below graduate level. In 2025 it was 62.5 per cent. Between 2017-18 and 2020-21 it rose from 55.8 per cent to 58.7 per cent.
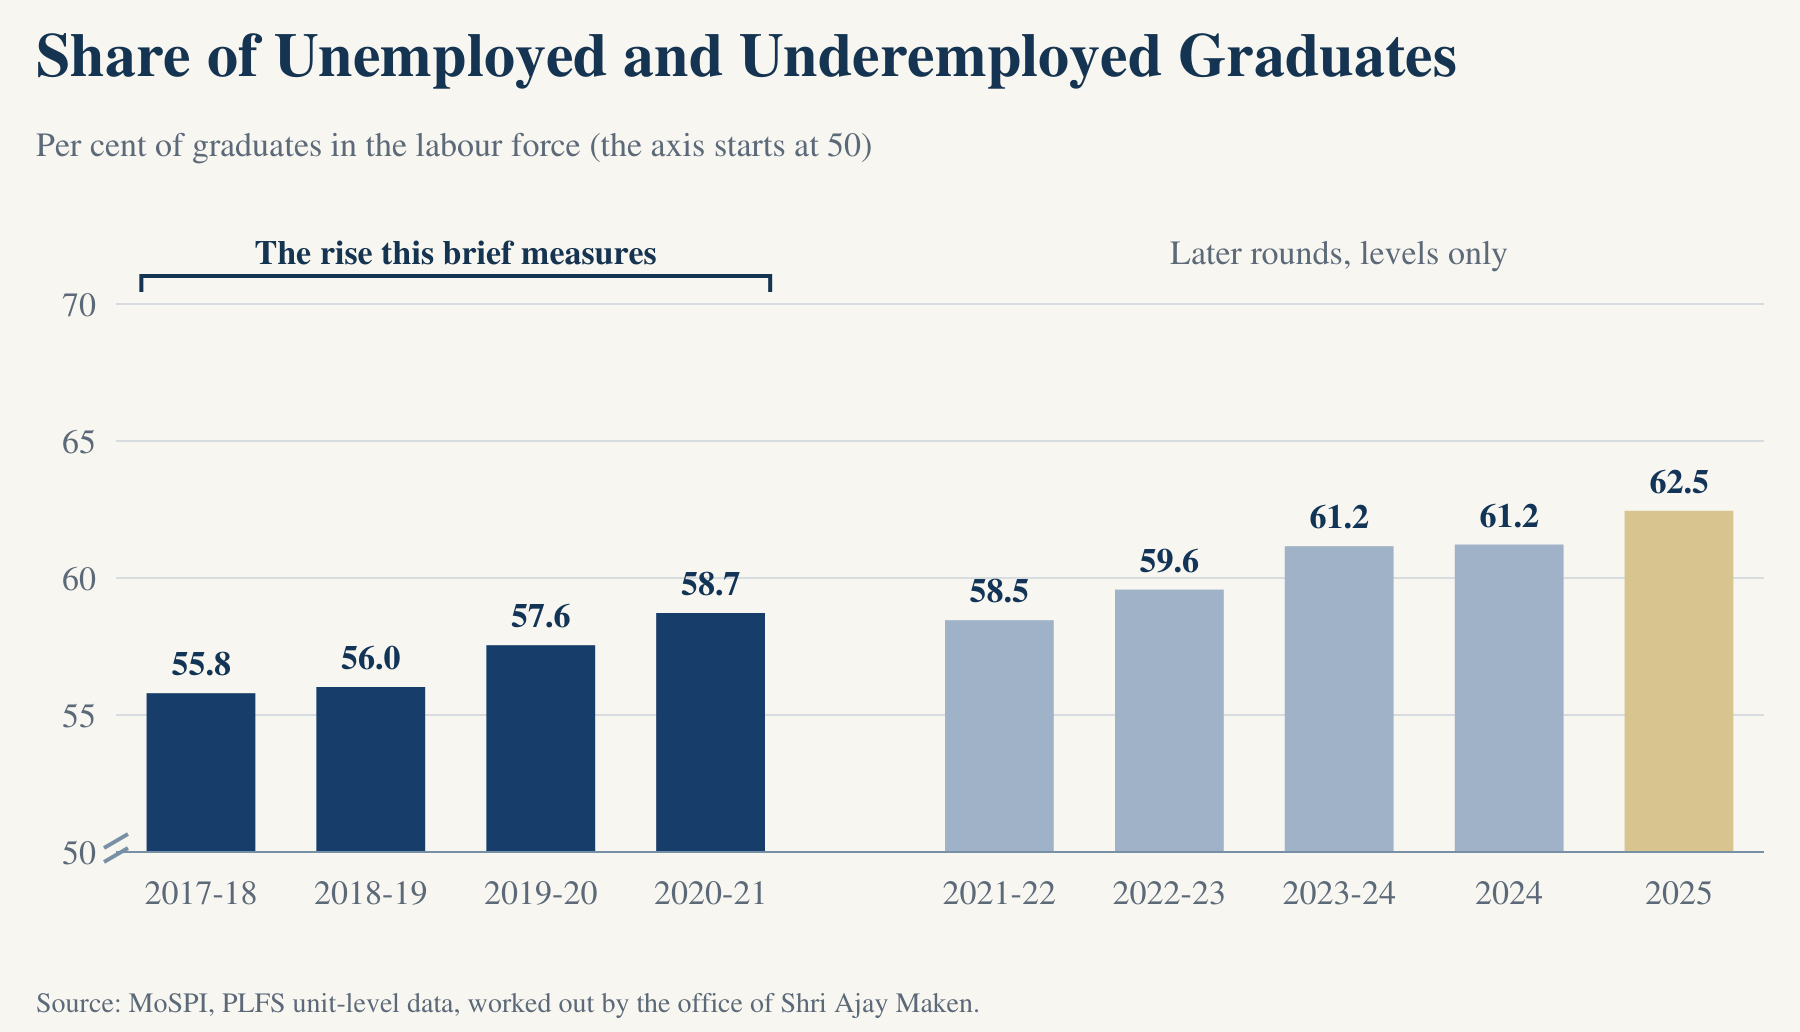
Source: MoSPI, Periodic Labour Force Survey, unit-level data; each round's catalogue page is linked in its CSV row and listed under Sources & method.
View the figures in a table
| Round | Per cent | MoSPI data |
|---|---|---|
| 2017-18 | 55.8 | unit-level data, catalogue 204 |
| 2018-19 | 56.0 | unit-level data, catalogue 216 |
| 2019-20 | 57.6 | unit-level data, catalogue 217 |
| 2020-21 | 58.7 | unit-level data, catalogue 206 |
| 2021-22 | 58.5 | unit-level data, catalogue 214 |
| 2022-23 | 59.6 | unit-level data, catalogue 210 |
| 2023-24 | 61.2 | unit-level data, catalogue 213 |
| 2024 | 61.2 | unit-level data, catalogue 254 |
| 2025 | 62.5 | unit-level data, catalogue 284 |
Share of Unemployed and Underemployed Graduates: Women and Men
In 2025 the share was 59.6 per cent for women graduates and 63.5 per cent for men graduates. For women it rose from 50.1 per cent in 2017-18 to 55.0 per cent in 2020-21, and for men from 57.2 per cent to 59.7 per cent over the same rounds.
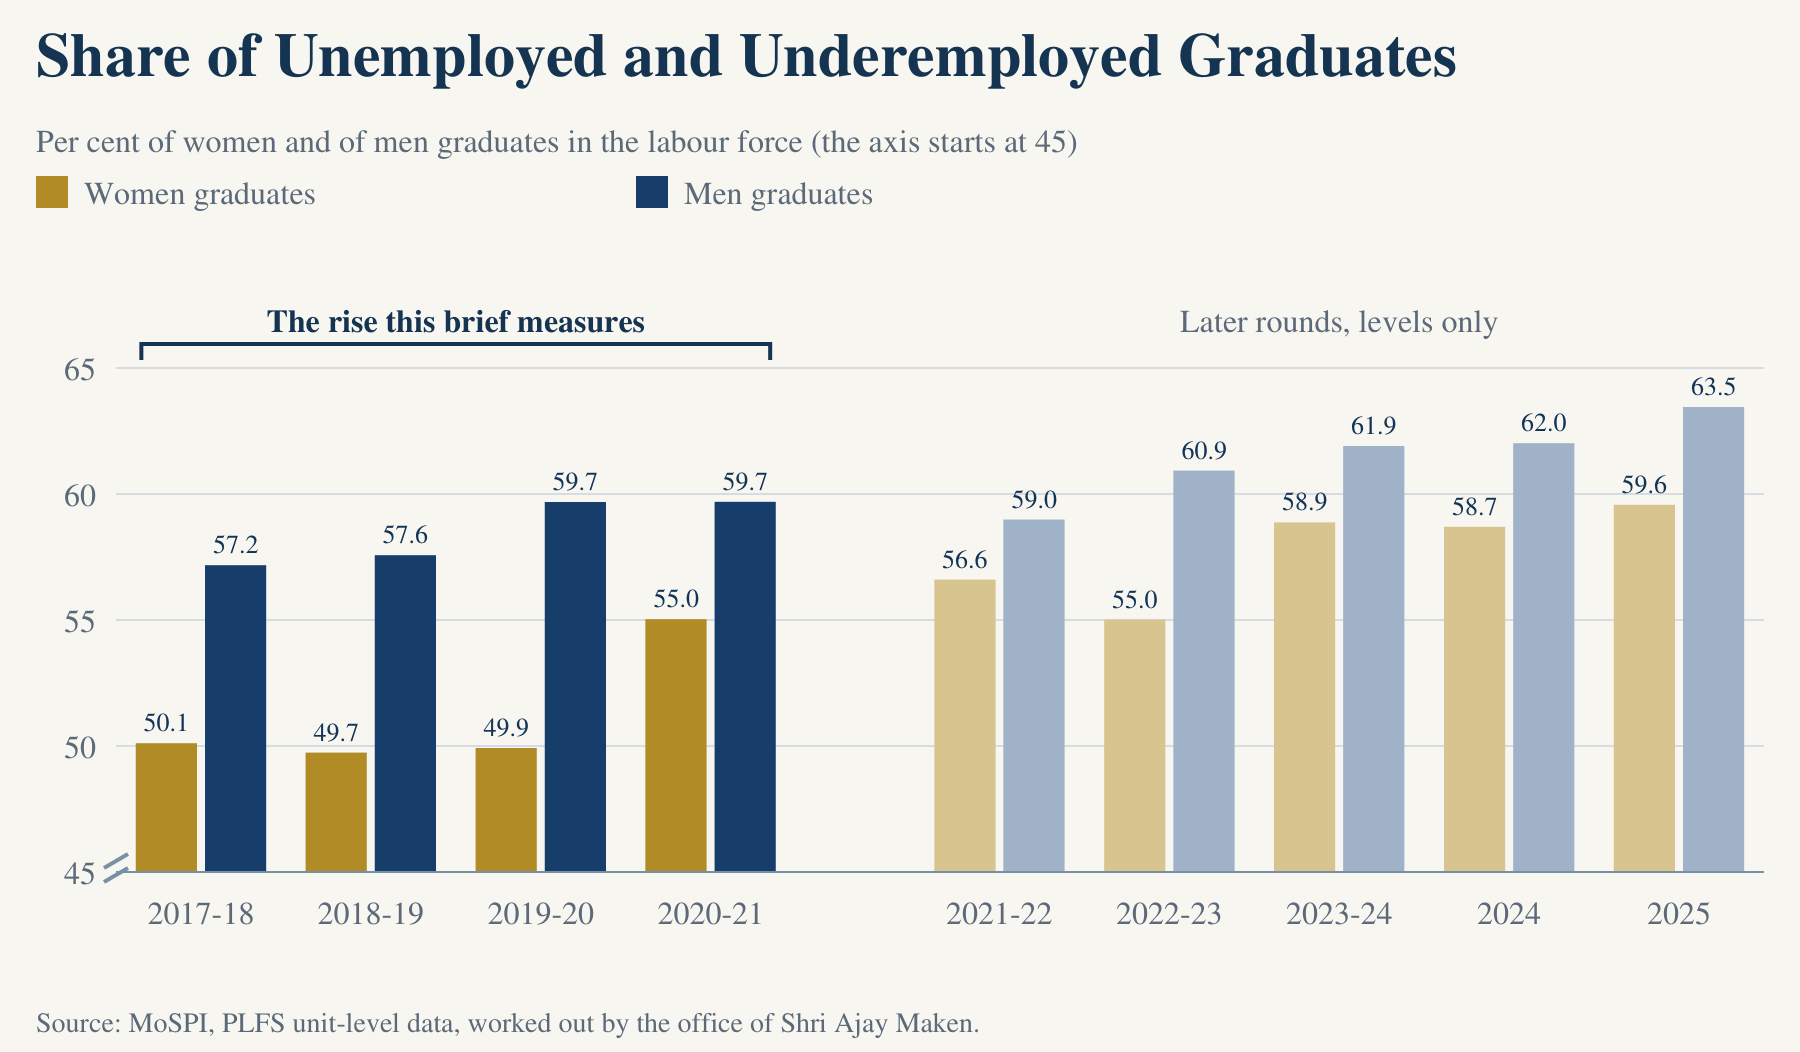
Source: MoSPI, Periodic Labour Force Survey, unit-level data; each round's catalogue page is linked in its CSV row and listed under Sources & method.
View the figures in a table
| Round | Per cent | MoSPI data |
|---|---|---|
| 2017-18 | 50.1 | unit-level data, catalogue 204 |
| 2018-19 | 49.7 | unit-level data, catalogue 216 |
| 2019-20 | 49.9 | unit-level data, catalogue 217 |
| 2020-21 | 55.0 | unit-level data, catalogue 206 |
| 2021-22 | 56.6 | unit-level data, catalogue 214 |
| 2022-23 | 55.0 | unit-level data, catalogue 210 |
| 2023-24 | 58.9 | unit-level data, catalogue 213 |
| 2024 | 58.7 | unit-level data, catalogue 254 |
| 2025 | 59.6 | unit-level data, catalogue 284 |
The Government's own grouping
The Government's own Economic Survey 2024-25 groups these jobs the same way. Its footnote 110 lists the semi-skilled jobs, as follows: "Semi-skilled occupations include clerks, skilled agricultural and fisherman, plant and machine operators, assembly workers, craft and related trades workers, service workers, shop and market sales workers".
The Survey calls graduates in such jobs "underemployed in roles below their educational qualifications", and this brief uses the word underemployed in that sense.
| Division | Occupations | How this brief counts it |
|---|---|---|
| 1 | Managers | not counted as below graduate level |
| 2 | Professionals | not counted as below graduate level |
| 3 | Technicians and Associate Professionals | not counted as below graduate level |
| 4 | Clerks/Clerical Support Workers | below graduate level |
| 5 | Service and Sales Workers | below graduate level |
| 6 | Skilled Agricultural, Forestry and Fishery Workers | below graduate level |
| 7 | Craft and Related Trades Workers | below graduate level |
| 8 | Plant and Machine Operators, and Assemblers | below graduate level |
| 9 | Elementary Occupations | below graduate level |
Source: Ministry of Finance, Economic Survey 2024-25, Chapter 12, Table XII.4 and footnote 110 .
Of every 1,000 graduates
Of every 1,000 graduates in the labour force in 2025, 625 had no work or a job below graduate level. In 2017-18 the figure was 558, and in 2020-21 it was 587.
Each count is the number of graduates, out of every 1,000 in the labour force, who had no work or a job below graduate level.
Source: MoSPI, PLFS unit-level data, worked out round by round.
Most graduates in the labour force do not have graduate work, and MoSPI's own records show the share without it growing from 2017-18 to 2020-21.
Terms, explained
- Graduate
- A graduate is a person whose highest completed level of general education is a graduate degree. People with a postgraduate degree are counted separately, so they are not included here.
- Labour force
- The labour force is everyone who works, together with everyone who seeks or is available for work. This brief uses MoSPI's usual status, which counts a person's main activity over the year and any subsidiary work.
- Unemployed
- A graduate is unemployed when MoSPI's survey records him or her as having no work while seeking or being available for work, on usual status.
- Underemployed
- A graduate is underemployed when he or she works in a job below graduate level. The Government's own Economic Survey 2024-25 uses the word in the same sense, for graduates "underemployed in roles below their educational qualifications".
- Below graduate level
- A job below graduate level is one in divisions 4 to 9 of the National Classification of Occupations. These divisions cover clerks, service and sales workers, skilled farm workers, craft and trades workers, machine operators and elementary occupations.
Downloads for readers and the press
Sources & method
MoSPI publishes the unit-level records of the Periodic Labour Force Survey on microdata.gov.in. This brief works out every figure from those records. Each person carries the survey's own weight, so that the figures describe India and not only the people interviewed.
Before any figure was used, the same code reproduced MoSPI's published unemployment rate for graduates. It matched in every annual round from 2017-18 to 2023-24 and in 2025, each time to one decimal. MoSPI published no rate for graduates for calendar 2024, so the code was checked there against MoSPI's published rates for all persons.
Every rise this brief states is measured from 2017-18 to 2020-21, and each is more than twice its standard error, so it is larger than sampling error alone would be likely to produce. The other rounds are printed as levels.
Every figure is rounded once, to one decimal, from the unrounded result. The downloadable files carry each round's figure, together with the address of its MoSPI data.
- MoSPI, PLFS July 2017 to June 2018, unit-level data (microdata.gov.in catalogue 204) .
- MoSPI, PLFS July 2018 to June 2019, unit-level data (microdata.gov.in catalogue 216) .
- MoSPI, PLFS July 2019 to June 2020, unit-level data (microdata.gov.in catalogue 217) .
- MoSPI, PLFS July 2020 to June 2021, unit-level data (microdata.gov.in catalogue 206) .
- MoSPI, PLFS July 2021 to June 2022, unit-level data (microdata.gov.in catalogue 214) .
- MoSPI, PLFS July 2022 to June 2023, unit-level data (microdata.gov.in catalogue 210) .
- MoSPI, PLFS July 2023 to June 2024, unit-level data (microdata.gov.in catalogue 213) .
- MoSPI, PLFS January to December 2024, unit-level data (microdata.gov.in catalogue 254) .
- MoSPI, PLFS January to December 2025, unit-level data (microdata.gov.in catalogue 284) .
- MoSPI, Annual Report, PLFS, July 2017 to June 2018 .
- MoSPI, Annual Report, PLFS, July 2018 to June 2019 .
- MoSPI, Annual Report, PLFS, July 2019 to June 2020 .
- MoSPI, Annual Report, PLFS, July 2020 to June 2021 .
- MoSPI, Annual Report, PLFS, July 2021 to June 2022 .
- MoSPI, Annual Report, PLFS, July 2022 to June 2023 .
- MoSPI, Annual Report, PLFS, July 2023 to June 2024 .
- MoSPI, Key employment and unemployment indicators, PLFS, calendar year 2024 .
- MoSPI, Annual Report, PLFS, 2025 .
- Ministry of Finance, Economic Survey 2024-25, Chapter 12, Table XII.4 and footnote 110 .