The seven-week fall
The Reserve Bank of India published the new observation on 30 October 2026. Its weekly table records reserves as on 23 October, so the publication date is a week after the observation date.
The reserve stock fell in each weekly comparison after the starting observation. The cumulative decline amounted to 8.39 per cent of its value on 4 September. Both the dollar decline and its percentage use the same starting and closing observations.
| Measure | Finding |
|---|---|
| The seven-week dollar decline | Reserves fell by US$65.958 billion. |
| The decline against the starting stock | Reserves fell by 8.39 per cent. |
| The comparison period | The window runs from 4 September to 23 October 2026. |
| The succession of weekly changes | Reserves fell in all seven weekly comparisons. |
Source [2]: RBI WSS, Table 2, issues from 11 September to 30 October 2026. The dollar decline is the difference between the published total-reserve levels on 4 September and 23 October. The percentage divides that decline by the starting level. Open the starting observation and the closing observation.
What the record measures
The record concerns the size of the decline in nominal US dollars. Each complete seven-week comparison in the held series is measured on that same basis, which lets the current period be compared with earlier periods of equal length.
The starting date of the historical series bounds the claim. The comparison covers the available weekly history beginning in September 1998, and it makes no claim about a complete weekly history before that date.
| Part of the comparison | Meaning |
|---|---|
| The quantity being compared | The calculation compares falls in the reported value of total foreign exchange reserves. |
| The unit being compared | Each decline is measured in nominal US dollars. |
| The duration being compared | Each complete comparison spans seven weekly intervals. |
| The historical coverage | The held weekly series begins in September 1998. |
Source [3]: Office calculations from the RBI weekly total-reserves series through 23 October 2026, checked on 30 October 2026. The ranking compares differences between published levels; the RBI does not publish this ranking in its weekly table.
The latest release prints a weekly fall of US$1.269 billion. That weekly change and the seven-week calculation describe different intervals, so the smaller weekly figure does not replace the cumulative decline.
The reported figures measure the value of reserve assets at their observation dates. The seven-week finding is a decline in that reported value. It does not identify the transactions behind every part of the change.
Source [4]: RBI WSS, 30 October 2026, Table 2, total-reserves row and its rounding note. The weekly figure uses the RBI's printed change column.
Annexure: Sources and method
The starting and closing levels come from the RBI's own weekly tables. The intervening observations were read from each issue, which establishes that the decline continued through seven successive weekly comparisons.
| RBI publication date | Observation date carried by Table 2 |
|---|---|
| 11 September 2026 | The table reports 4 September 2026. |
| 18 September 2026 | The table reports 11 September 2026. |
| 25 September 2026 | The table reports 18 September 2026. |
| 2 October 2026 | The table reports 25 September 2026. |
| 9 October 2026 | The table reports 2 October 2026. |
| 16 October 2026 | The table reports 9 October 2026. |
| 23 October 2026 | The table reports 16 October 2026. |
| 30 October 2026 | The table reports 23 October 2026. |
Source [5]: RBI Weekly Statistical Supplement, Table 2, the eight issues linked above. The observation date is read from each table's heading, and the printed US$ million values supply the basis for conversion to billions.
The calculation subtracts the closing total from the starting total, retaining the source's printed US$ million values. It converts the result to billions for display. The percentage is calculated before it is rounded for display.
The historical comparison excludes spans crossing longer gaps in the held weekly record. It retains the recorded shifts around holidays, and an additional calculation using exact weekly spacing gives the same dollar-record conclusion. The coverage statement remains attached to the record wherever it is used.
The publisher rounds levels and weekly changes separately. A difference between two printed levels can therefore differ from the separately printed weekly change. The cumulative result uses the difference of printed total levels throughout, while the latest weekly figure is quoted as the RBI prints it.
Source [6]: RBI WSS, Table 2 and its rounding note, 30 October 2026; office historical comparison and independent source calculations checked on 30 October 2026. The findings concern reserve stocks and their reported values.
The seven-week fall
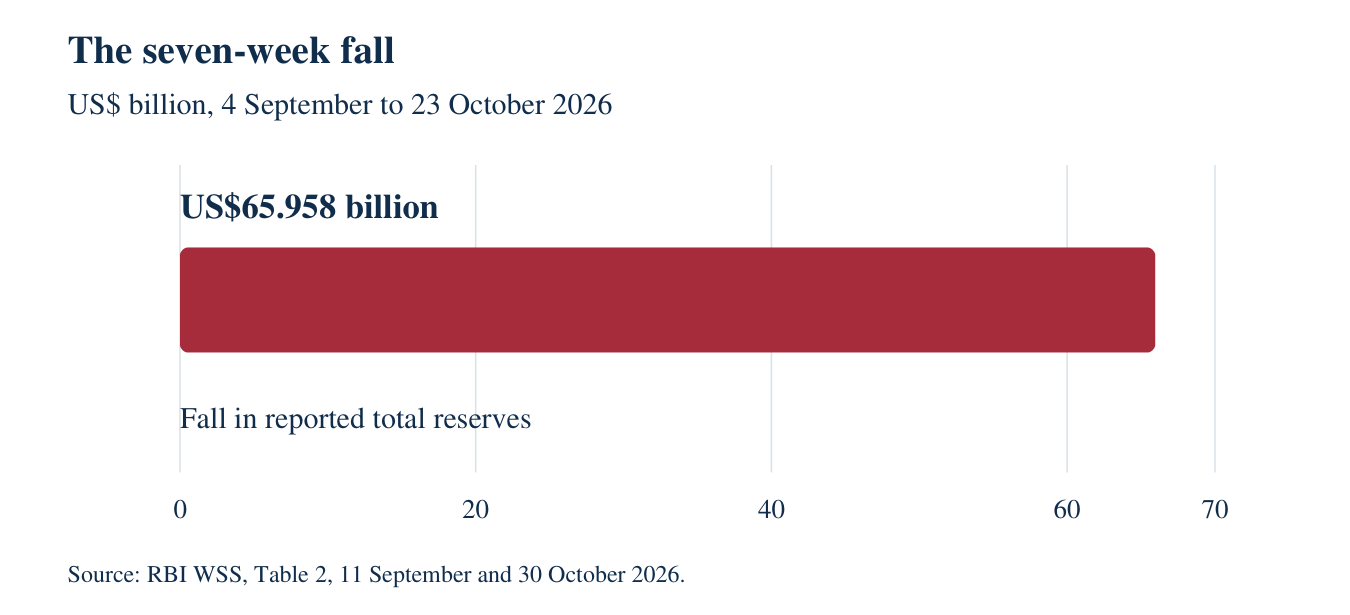
Source: RBI Weekly Statistical Supplement , 2026-09-11; RBI Weekly Statistical Supplement , 2026-10-30. The calculation subtracts the closing total from the starting total.
Downloads
RBI sources
- RBI Weekly Statistical Supplement . 2026-09-11. Table 2, reserves as on 2026-09-04.
- RBI Weekly Statistical Supplement . 2026-09-18. Table 2, reserves as on 2026-09-11.
- RBI Weekly Statistical Supplement . 2026-09-25. Table 2, reserves as on 2026-09-18.
- RBI Weekly Statistical Supplement . 2026-10-02. Table 2, reserves as on 2026-09-25.
- RBI Weekly Statistical Supplement . 2026-10-09. Table 2, reserves as on 2026-10-02.
- RBI Weekly Statistical Supplement . 2026-10-16. Table 2, reserves as on 2026-10-09.
- RBI Weekly Statistical Supplement . 2026-10-23. Table 2, reserves as on 2026-10-16.
- RBI Weekly Statistical Supplement . 2026-10-30. Table 2, reserves as on 2026-10-23.