2004-2014 versus 2014-2026
India's Centre-and-states gross debt/GDP rose 16.27 percentage points from March 2014 to March 2026, as the October 2026 IMF estimate shows. That increase reversed most of the 17.89-point fall from March 2004 to March 2014. The ratios were 85.88%, 67.99% and 84.26%, respectively, while the comparison covers ten years before March 2014 and twelve years afterwards.
| One October 2026 IMF vintage | March 2004 % GDP | March 2014 % GDP | March 2026 estimate % GDP | 2004-2014: 10 years, pp | 2014-2026: 12 years, pp |
|---|---|---|---|---|---|
| Centre + states gross debt | 85.88 | 67.99 | 84.26 | -17.89 | +16.27 |
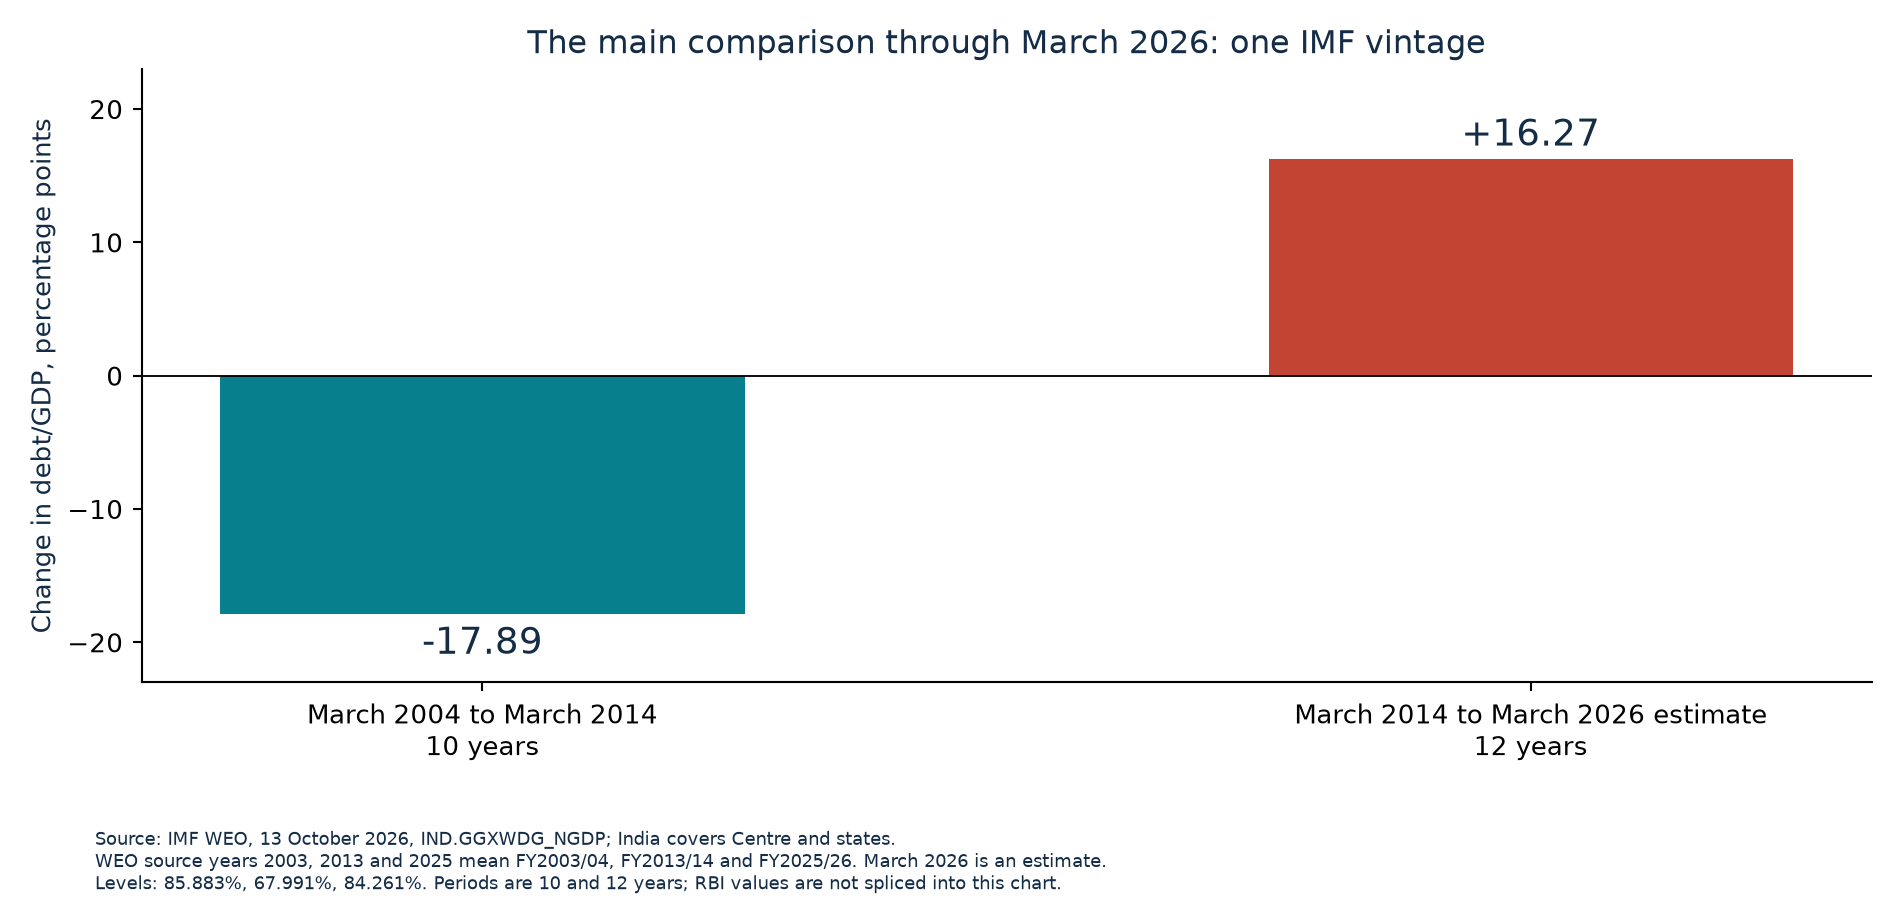
The main comparison is March 2004 to March 2014 versus March 2014 to March 2026: ten years against twelve years. Changes are endpoint differences in percentage points, not annual rates or cumulative investment returns. The separate growth-and-interest reconstruction retains its two ten-year historical windows because its matched historical gross-interest inputs stop earlier.
Source: IMF, World Economic Outlook October 2026, 13 October 2026; India update 24 September 2026. Countries sheet, IND.GGXWDG_NGDP.A, 2003/2013/2025/2026 year cells and country-specific fiscal-year/coverage metadata.
The RBI companion also reaches March 2026
RBI Table 240 offers a separate companion comparison through March 2026. Combined liabilities/GDP changed by -16.17 points from March 2004 to March 2014 and +14.79 points from March 2014 to March 2026. The final ratio, 81.85%, is a Budget Estimate in the table published on 31 July 2026. It is not substituted for the IMF estimate or described as a final outturn.
| RBI measure | March 2004 % GDP | March 2014 % GDP | March 2026 BE % GDP | 10-year change, pp | 12-year change, pp |
|---|---|---|---|---|---|
| Centre + states, consolidated | 83.23 | 67.06 | 81.85 | -16.17 | +14.79 |
| Centre only | 65.98 | 52.16 | 56.17 | -13.82 | +4.01 |
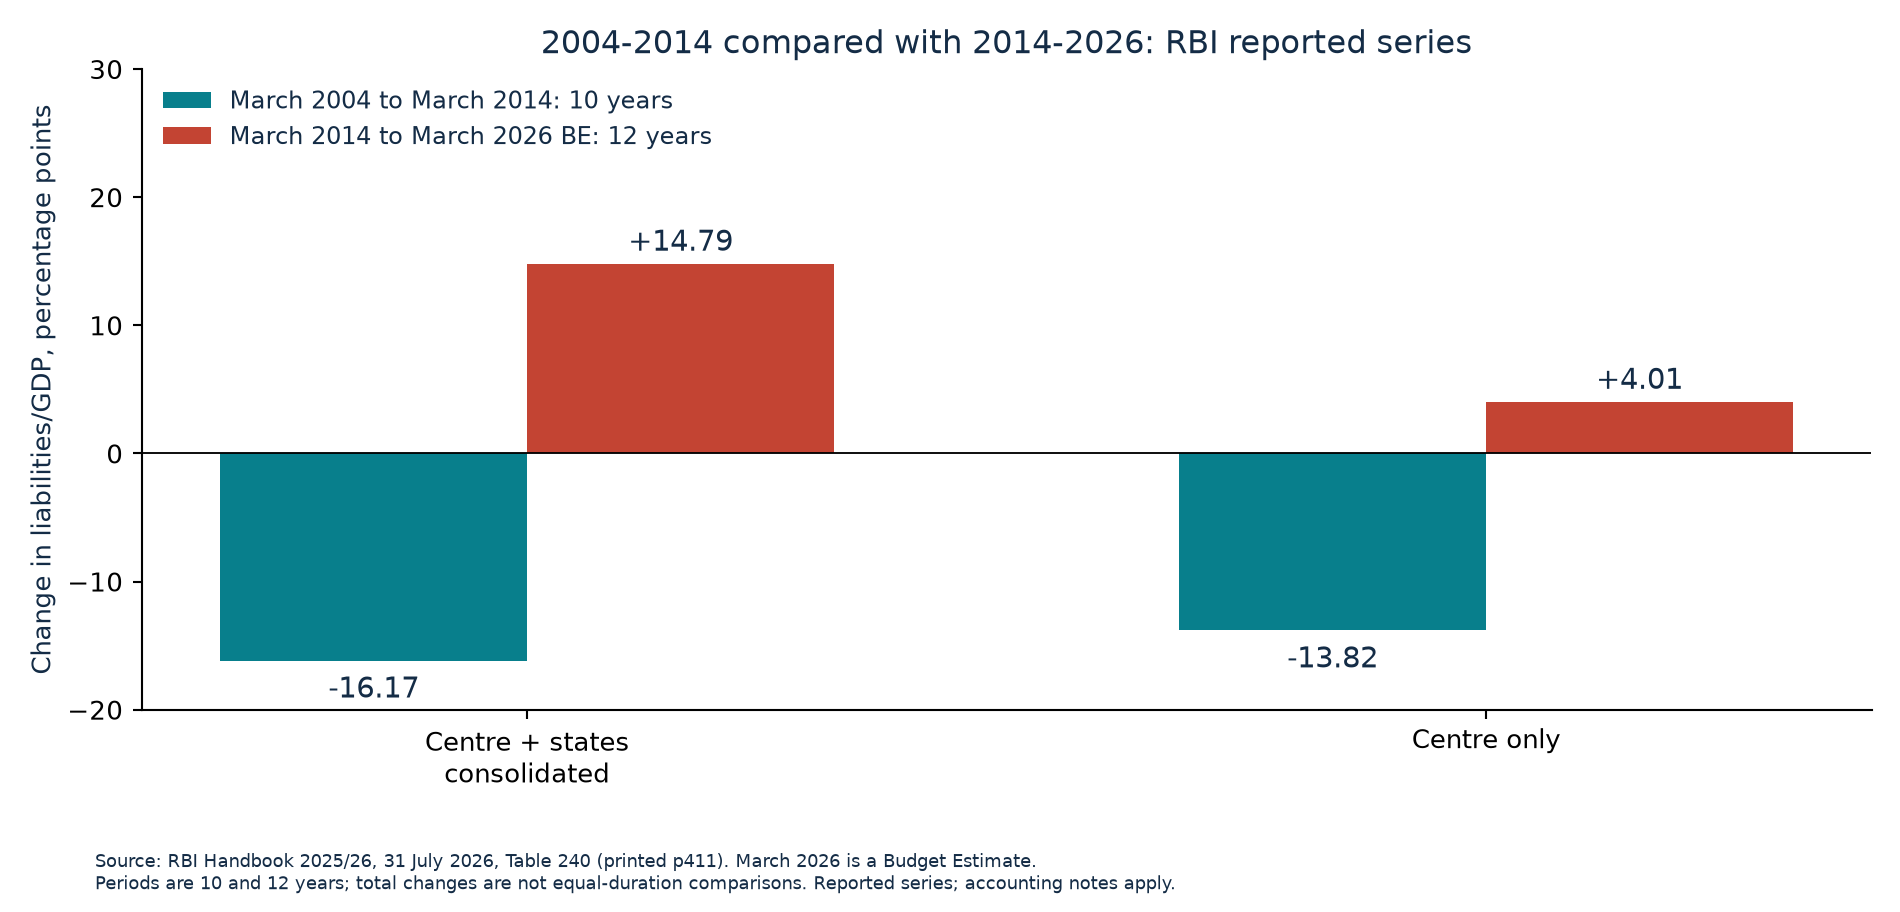
The RBI companion uses its own published liabilities series. Combined Centre-and-states liabilities/GDP fell from 83.23% in March 2004 to 67.06% in March 2014, then stood at a Budget Estimate of 81.85% for March 2026. The changes are -16.17 and +14.79 percentage points. Centre-only ratios were 65.98%, 52.16% and a Budget Estimate of 56.17%, giving changes of -13.82 and +4.01 points. The first interval spans ten years and the second twelve. The combined line includes state governments under different parties; these movements do not isolate one government's causal effect.
Source: RBI, Handbook of Statistics on the Indian Economy 2025/26, 31 July 2026. Table 240, printed p411 / PDF p1, columns 4 and 7; rows FY2003/04, FY2013/14, FY2018/19, FY2020/21, FY2023/24, FY2024/25 RE and FY2025/26 BE; notes 1-6.
Keep the complete path visible
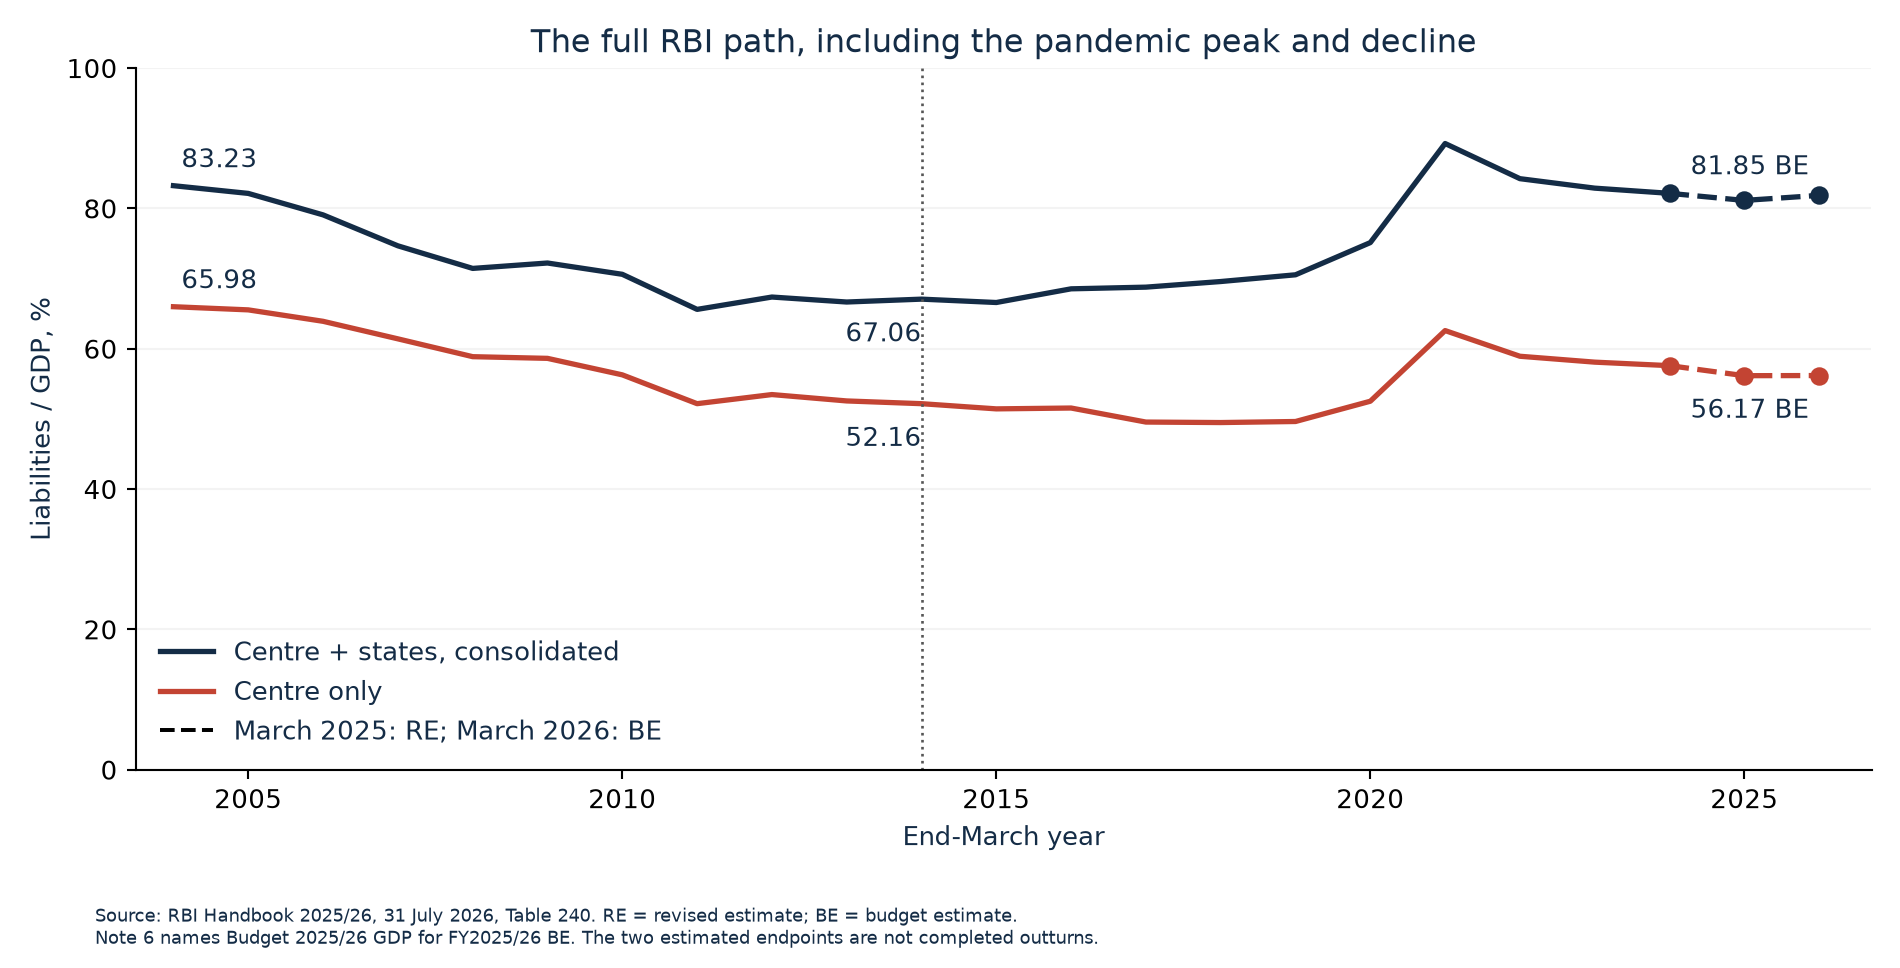
The annual paths retain the global financial crisis, the pandemic peak and the later decline. The main comparison ends in March 2026 and does not claim an uninterrupted annual rise. In the RBI companion, the clean comparison before COVID runs from March 2014 to March 2019: combined liabilities/GDP rose from 67.06% to 70.53%, while the Centre-only ratio fell from 52.16% to 49.62%. The financial year ending March 2020 includes the pandemic's first weeks. The RBI March 2025 and March 2026 endpoints retain their Revised Estimate and Budget Estimate labels.
The main comparison uses one October 2026 IMF WEO vintage throughout. Its India metadata covers Centre and states; state inputs can lag by up to two years. IMF staff estimate the general-government series, and accounting, coverage, valuation and GDP treatments can affect movements. The RBI companion retains its separate consolidation and accounting notes, including intergovernmental adjustments and the stated extra-budgetary-resource treatment. A common-definition bridge would be needed to separate every policy and statistical contribution. No RBI opening value is joined to an IMF closing value.
Source: RBI, Handbook of Statistics on the Indian Economy 2025/26, 31 July 2026. Table 240, printed p411 / PDF p1, columns 4 and 7; rows FY2003/04, FY2013/14, FY2018/19, FY2020/21, FY2023/24, FY2024/25 RE and FY2025/26 BE; notes 1-6.
The last two years inside the main comparison
| Closing date | Financial year | IMF gross debt / GDP % | Status |
|---|---|---|---|
| March 2024 | 2023/24 | 84.749 | IMF estimate; central and state inputs have different actual-data endpoints |
| March 2025 | 2024/25 | 84.805 | IMF estimate; central and state inputs have different actual-data endpoints |
| March 2026 | 2025/26 | 84.261 | IMF estimate; central and state inputs have different actual-data endpoints |
| March 2027 | 2026/27 | 83.079 | IMF projection/current-year estimate |
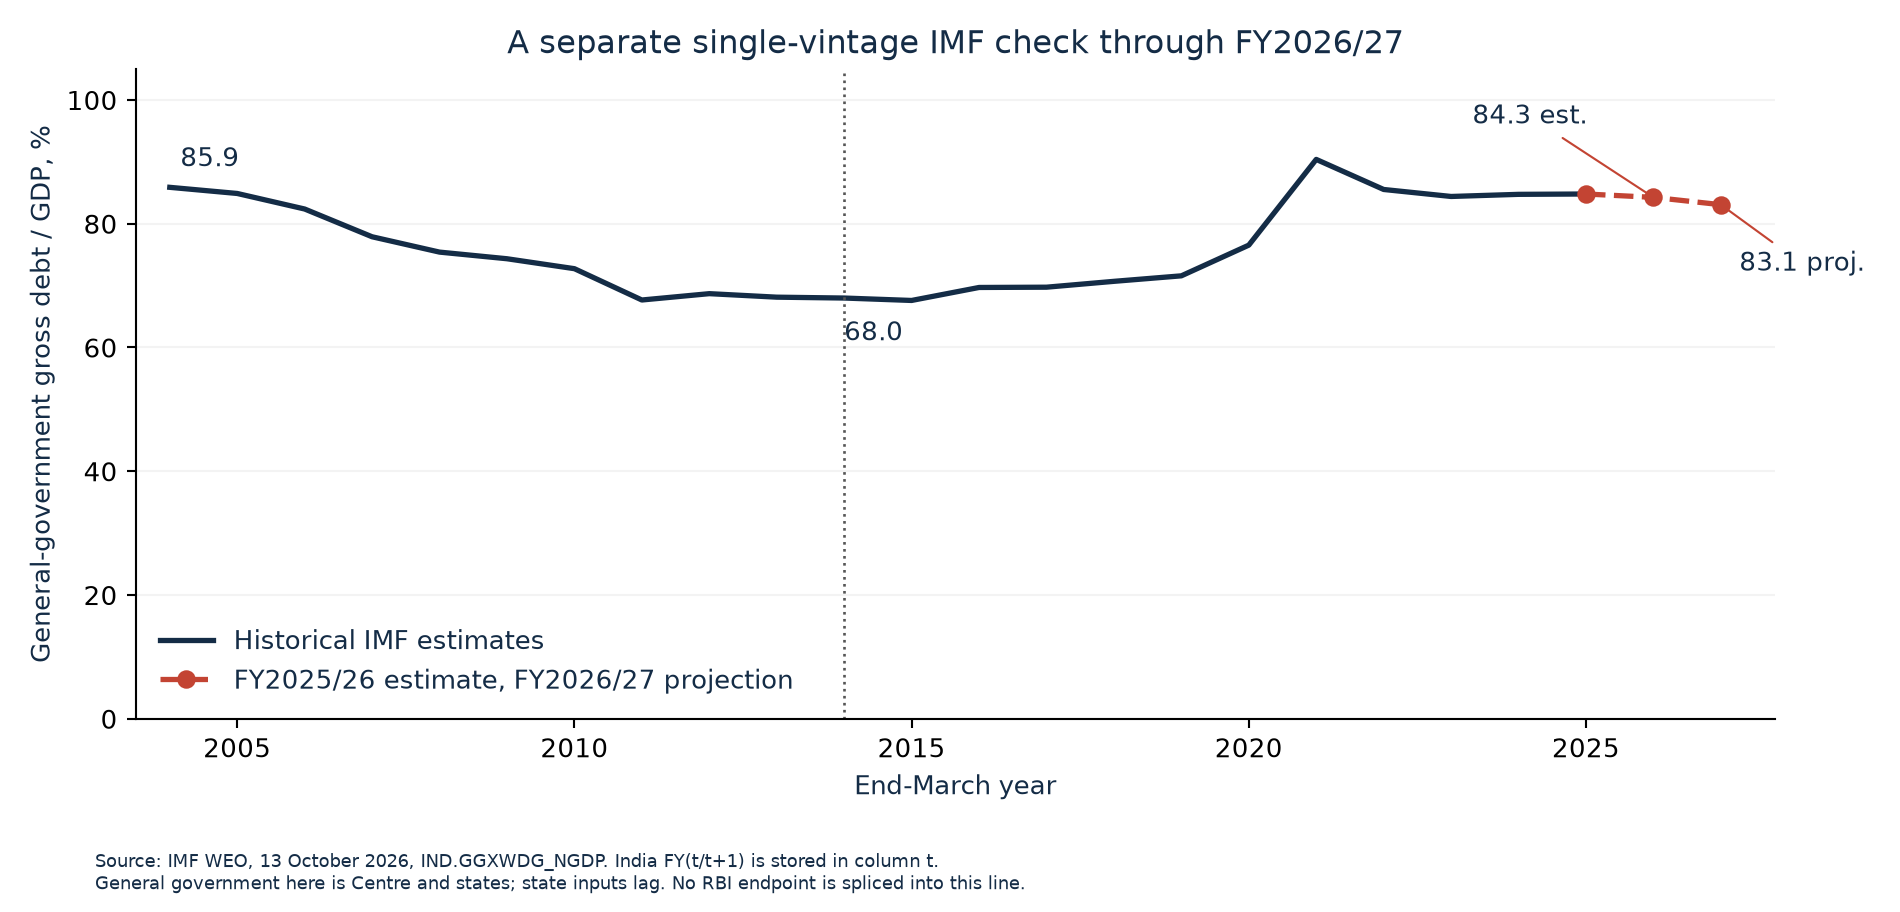
March 2026 is inside the main comparison. The October 2026 IMF WEO estimates Centre-and-states gross debt at 84.261% of GDP for FY2025/26, closing in March 2026. Its source-year column 2025 carries that fiscal year. The source-year column 2026 projects 83.079% for FY2026/27, closing in March 2027. Separately, RBI Table 240 reports 81.13% for March 2025 as a Revised Estimate and 81.85% for March 2026 as a Budget Estimate. RBI note 6 specifies Union Budget 2025/26 GDP for FY2025/26 alone. The two sources retain their own values and status.
The main comparison keeps the October 2026 IMF vintage for all three endpoints. WEO source years 2003, 2013 and 2025 map to financial years ending in March 2004, March 2014 and March 2026. Their unrounded ratios are 85.883%, 67.991% and 84.261%. The calculated changes are -17.892 and +16.270 percentage points across ten and twelve years. India-specific metadata covers Centre and states and records lags in state data. The March 2026 endpoint is an IMF estimate.
Source: IMF, World Economic Outlook October 2026, 13 October 2026; India update 24 September 2026. Countries sheet, IND.GGXWDG_NGDP.A, 2003/2013/2025/2026 year cells and country-specific fiscal-year/coverage metadata.
The Centre's current interest burden is a separate supporting concern. Interest takes 39.7% of revenue receipts in the FY2026/27 Budget Estimate, against 37.6% in the FY2025/26 provisional, unaudited accounts. Revenue receipts here mean tax retained after the states' share plus non-tax revenue; borrowing and capital receipts are excluded. These Centre-only shares cannot be joined to the historical Centre-and-states interest/revenue series. The Budget's planned borrowing-cost and growth illustration remains dated to February 2026 and is not the latest observed effective rate.
Sources: Union Budget 2026/27, February 2026, Budget at a Glance, PDF p5 rows1/11; Finance Ministry FY2025/26 provisional accounts, 1 June 2026.
Historical cost-and-growth context through 2024
| Annual reconstructed mean | FY2004/05-FY2013/14 | FY2014/15-FY2023/24 |
|---|---|---|
| Nominal GDP growth % | 14.9 | 10.1 |
| Implicit interest cost % | 7.7 | 7.4 |
| Growth minus cost, pp | 7.2 | 2.8 |
| Gross primary deficit %GDP | 2.7 | 3.1 |
| Gross interest / revenue % | 25.7 | 25.1 |
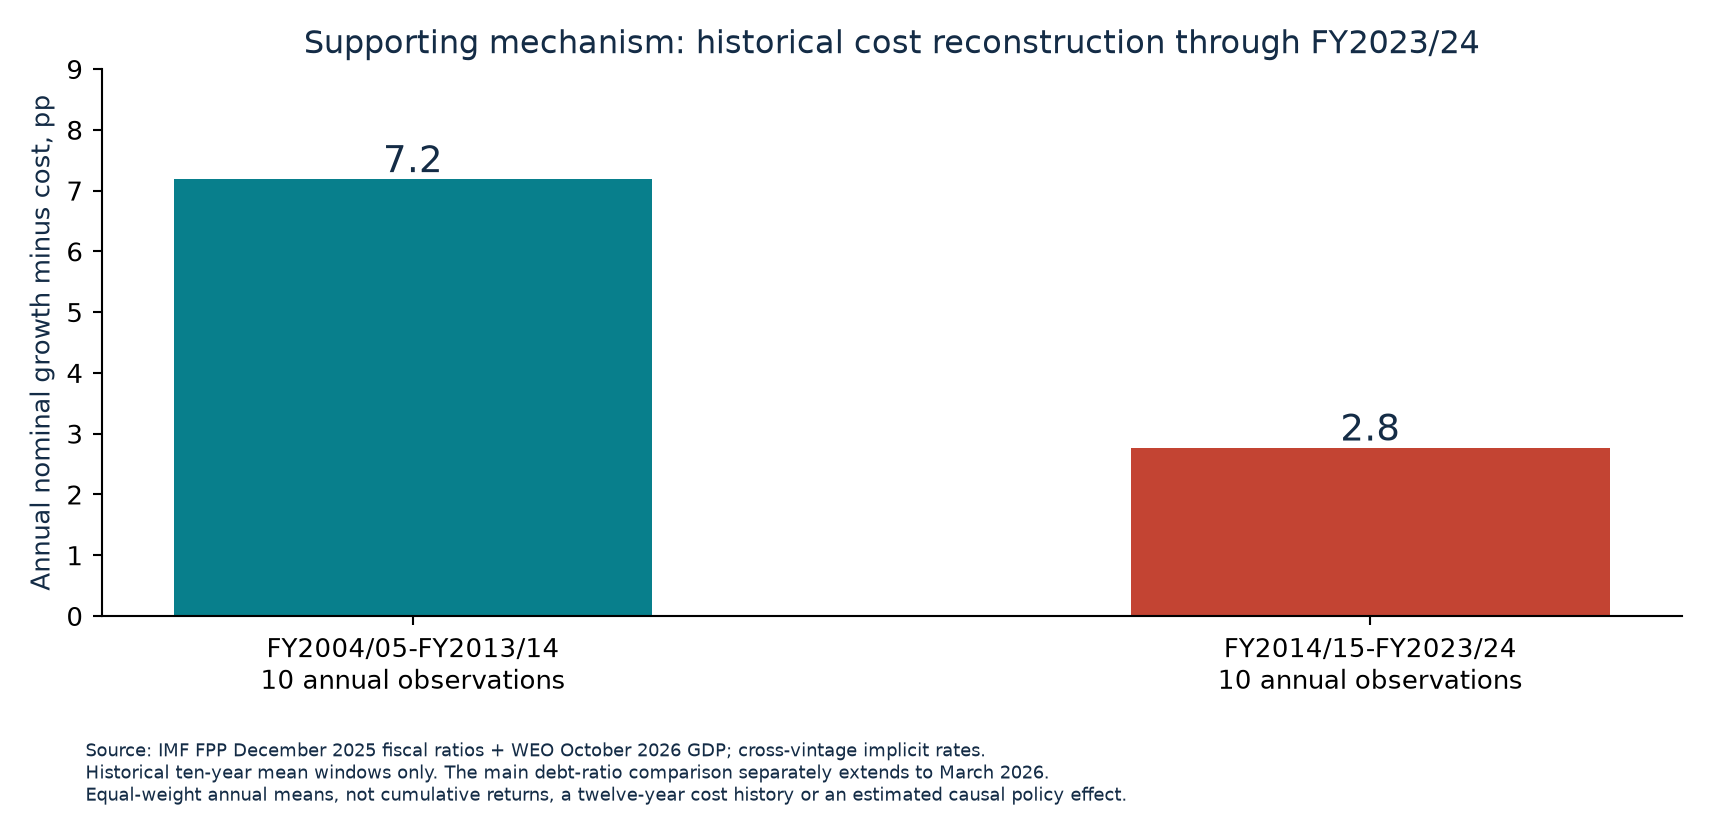
These are equal-weight means of ten annual observations in each period. The historical general-government interest/revenue share fell slightly. It cannot be joined to the Centre-only current shares.
Sources: IMF Public Finances in Modern History, December 2025 fiscal data, and October 2026 WEO GDP. Implicit rates combine data vintages; these are descriptive calculations and do not identify a policy effect.
The reversal after 2014 has a public cost
The October 2026 IMF estimate places India's Centre-and-states debt/GDP 16.27 percentage points above March 2014 by March 2026, reversing most of the 17.89-point fall between March 2004 and March 2014. The first interval spans ten years and the second twelve. Separately, the Centre's FY2026/27 Budget commits 39.74% of revenue receipts to interest.
| Period | Reported movement |
|---|---|
| March 2004 to March 2014, 10 years | IMF Centre-and-states debt/GDP fell by 17.89 percentage points. |
| March 2014 to March 2019 | The combined ratio rose by 3.47 points, while the Centre-only ratio fell from 52.16% to 49.62%. |
| March 2014 to March 2026, 12 years | The same IMF vintage shows a rise of 16.27 points to the March 2026 estimate. |
The reconstructed annual growth-over-interest-cost cushion narrowed from 7.18 to 2.77 points between FY2004/05-FY2013/14 and FY2014/15-FY2023/24. Fiscal and GDP inputs use different vintages. The calculation describes the arithmetic without identifying a policy effect.
Sources: IMF October 2026 WEO, India debt/GDP, source years 2003/2013/2025; RBI Handbook 2025/26, 31 July 2026, Table 240, printed p411 and notes; CGA FY2026/27 Budget column. Interest: Rs 14,03,972 crore / revenue receipts Rs 35,33,150 crore x 100. The current figure is a Budget estimate. Historical general-government interest/revenue means of 25.71% and 25.15% cannot be spliced onto the Centre-only share.
India and France face different debt constraints
India borrows mainly in rupees, while France shares the euro and ECB monetary policy. Domestic borrowing still imposes costs on taxpayers through the adjustments it requires. France's Treasury projects general-government interest rising from 2.2% of GDP in 2025 to 3.7% in 2030.
France's provisional debt ratio was 119.1% at end-June 2026. India's 83.079% is an October WEO projection for FY2026/27, ending March 2027. Their dates, government coverage and estimate status differ, preventing a precisely matched ranking.
Sources: French Treasury, 6 October 2026; IMF India Article IV, November 2025, Annex V, printed p56; IMF October 2026 WEO; ECB intervention eligibility, 21 July 2022.
Which EU countries deserve attention?
| Country | Debt/GDP, Q2 2026 % | Year-on-year debt change, pp | Overall balance/GDP, 2025 % |
|---|---|---|---|
| France | 119.1 | +3.7 | -5.1 |
| Italy | 139.9 | +2.2 | -3.1 |
| Belgium | 110.2 | +3.8 | -5.2 |
| Romania | 59.4 | +2.5 | -7.8 |
| Poland | 64.5 | +6.7 | -7.2 |
| Finland | 90.2 | +1.9 | -3.8 |
| Greece | 140.8 | -11.2 | +2.0 |
| Spain | 101.4 | -1.8 | -2.4 |
| Portugal | 92.5 | -3.4 | +0.7 |
High debt and persistent deficits put pressure on France, Italy and Belgium. Romania and Poland combine lower debt with large deficits. Greece, Spain and Portugal have declining year-on-year debt ratios. These observations concern debt pressures; they do not form an official distress ranking.
Sources: Eurostat Q2 debt, 21 October 2026; Eurostat revised 2025 balances, 21 October 2026. Negative balances are deficits; positive balances are surpluses. Quarterly debt is provisional, and published changes can differ from subtraction of rounded ratios.
The Commission's medium-term high-risk group comprises Belgium, Germany, Greece, Spain, France, Italy, Hungary, Austria, Poland, Romania, Slovakia and Finland. Debt Sustainability Monitor 2025, published 12 February 2026, printed pp8 and 42, uses the Autumn 2025 forecast and assumes no further fiscal-policy changes from 2027. This conditional screen does not identify imminent defaults.
The Indian evidence establishes a reversal after 2014, alongside the pandemic jump and later decline. It does not establish a continuous deterioration over all 26 years or an imminent default.
History across both country groups, 2003-2026
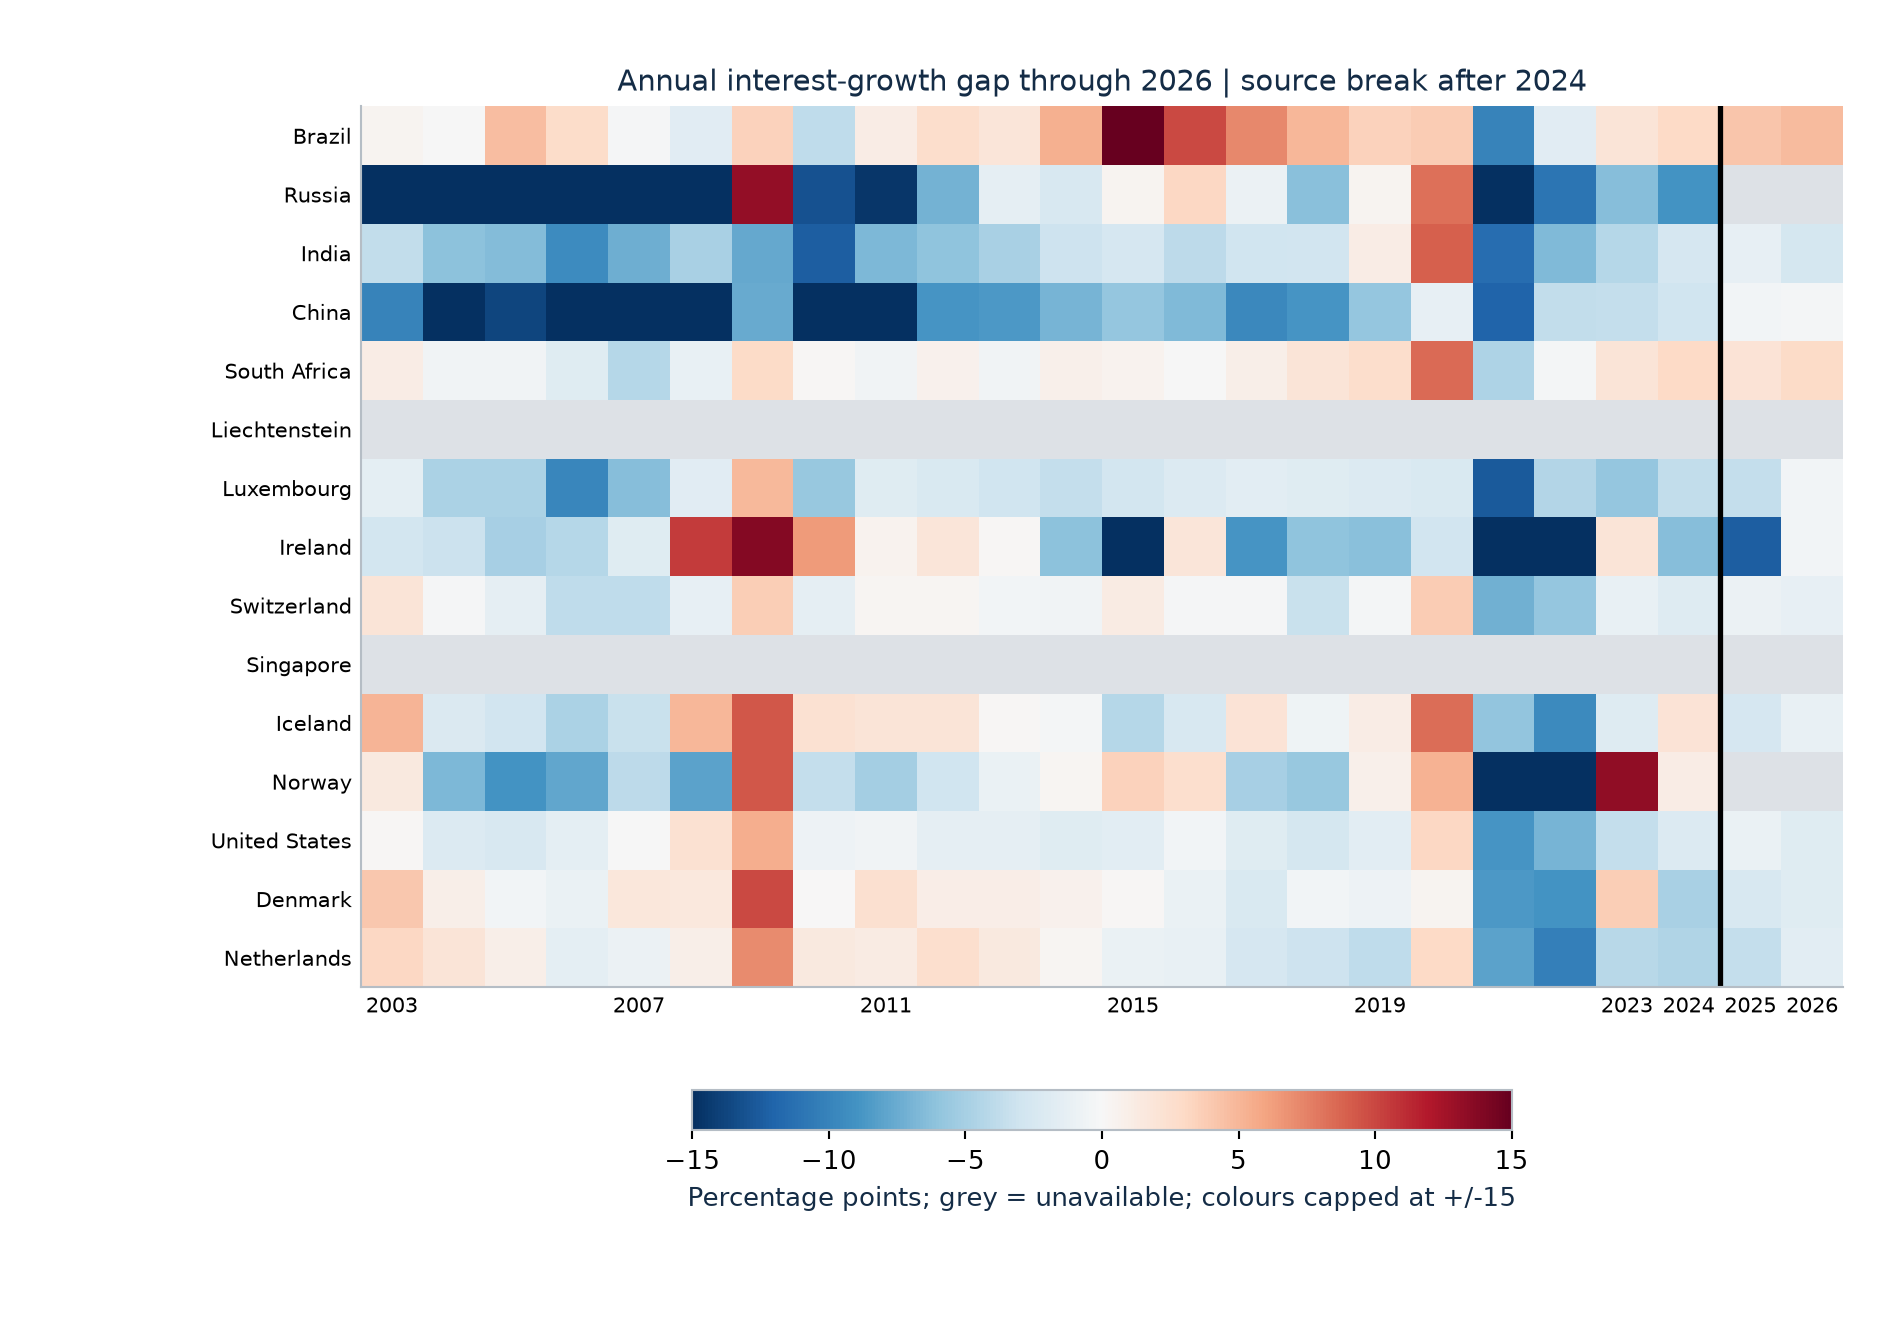
Gaps can be calculated for 308 of 360 requested country-years. The black line separates the historical reconstruction from the new 2025-2026 sources. Grey means unavailable. The full reports retain six periods through 2026, country profiles and the source-perimeter warnings.
Historical sources: IMF FPP December 2025 and WEO October 2026. Extension: OECD EO119 June 2026; IMF Brazil July 2026, China February 2026, India November 2025; South Africa MTBPS21October 2026. Latest values are estimates, projections or Budget assumptions. The fixed rich-country cohort is IMF-covered sovereigns ranked by 2025 nominal-dollar GDP per person; Monaco is outside that universe.
What the record requires us to examine
The comparison through March 2026 shows that most of the earlier reduction in India's Centre-and-states debt ratio had been reversed, on the October 2026 IMF estimate. The ten-year fall before March 2014 and twelve-year rise afterwards belong at the centre of the record. Public accountability requires examining that movement alongside growth, primary balances, interest, repayments and accounting changes. The figures establish the ratio movement; they do not establish default, a debt trap or a cut to a named public service.
Public report · Executive Summary
Source: RBI, Handbook of Statistics on the Indian Economy 2025/26, 31 July 2026. Table 240, printed p411 / PDF p1, columns 4 and 7; rows FY2003/04, FY2013/14, FY2018/19, FY2020/21, FY2023/24, FY2024/25 RE and FY2025/26 BE; notes 1-6.
Source: IMF, World Economic Outlook October 2026, 13 October 2026; India update 24 September 2026. Countries sheet, IND.GGXWDG_NGDP.A, 2003/2013/2025/2026 year cells and country-specific fiscal-year/coverage metadata.