The September figure, due on Monday 12 October
The Ministry's release of 14 September 2026 says: "CPI for September 2026 will be released on 12th October, 2026 (Monday) or the next working day in case of 12th being a holiday." The August figure went up at 4 pm on 14 September 2026. The September figure is the rate for September 2026 measured against September 2025, and it is the Ministry's own.
On 7 October 2026 the Reserve Bank's Monetary Policy Committee raised the repo rate, the rate at which the Bank lends to banks, by 25 basis points, a quarter of a percentage point, to 5.50 per cent. It changed its stance to what it calls calibrated tightening, and it explained that term in its own words: "rate cuts are off the table in the near term and policy action ahead can only be a rate hike or a pause, depending on the evolving conditions and the outlook". It projects inflation of 5.2 per cent for 2026-27. For October to December 2026 it projects 6.0 per cent, which is the top of its tolerance band, and for January to March 2027 it projects 5.7 per cent. Over the next three quarters it expects inflation to average almost 5.8 per cent.
The resolution says that "CPI inflation is projected to be 5.2 per cent for 2026-27 with Q2 at 4.9 per cent; Q3 at 6.0 per cent; and Q4 at 5.7 per cent", and that headline inflation is "expected to average almost 5.8 per cent in the next three quarters".
| Period | Projected rate, per cent |
|---|---|
| July to September 2026 | 4.9 |
| October to December 2026 | 6.0 |
| January to March 2027 | 5.7 |
| 2026-27 as a whole | 5.2 |
| April to June 2027 | 5.6 |
The Bank's 4.9 per cent for July to September was published on 7 October 2026, when the Ministry had already printed July at 4.45 per cent and August at 4.82 per cent. If the quarter's figure is the average of its three months, it implies a September rate near 5.4 per cent, between about 5.3 and 5.6 after the Bank's rounding to one decimal. Every figure in that range is above the 5.22 per cent of December 2024, so it would be at least the highest since November 2024. That is arithmetic on the Bank's published figures, and the Ministry's own figure arrives on Monday.
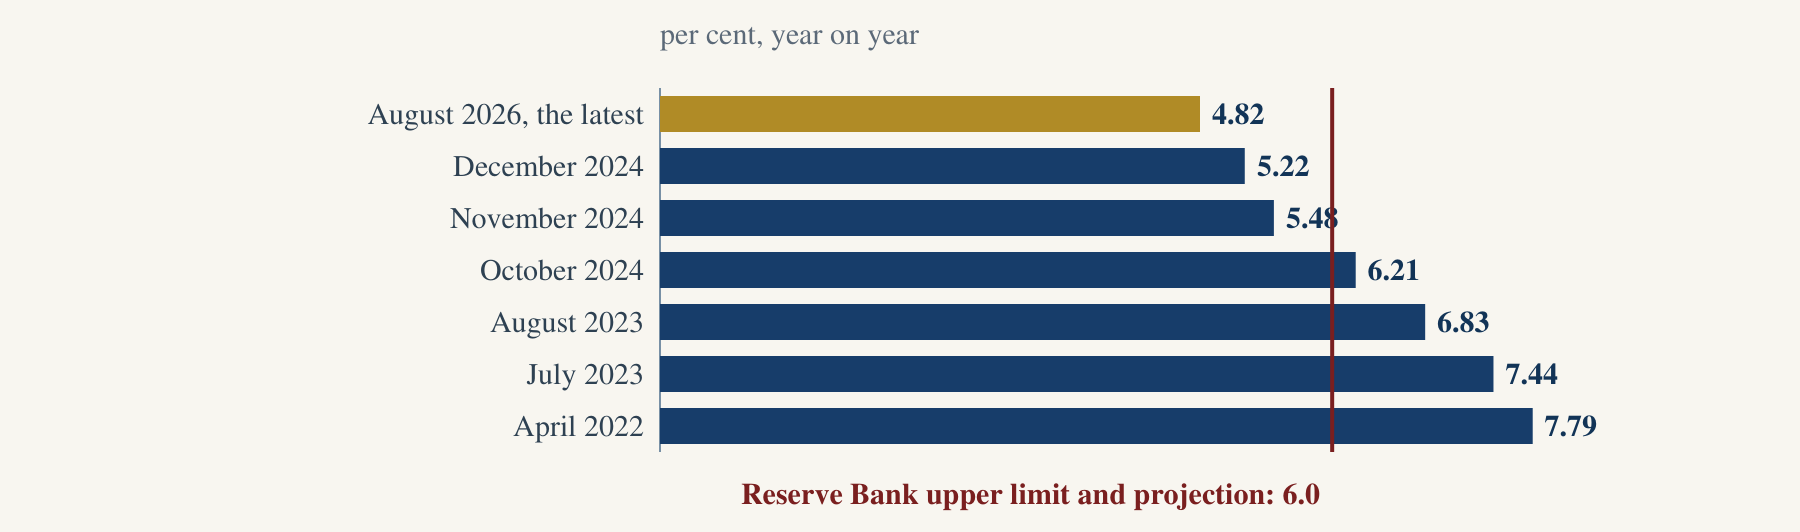
August's 4.82 per cent is already the highest rate in 20 months. Any September figure above it makes eleven months of rising inflation in a row, and the highest rate since December 2024. A figure above 5.22 per cent would be the highest since November 2024, and one above 5.48 per cent the highest since October 2024. At 6.0 per cent the rate reaches the Reserve Bank's upper limit, and 6.0 per cent is what the Bank itself projects for the quarter after September's, which is October to December 2026.
| If the rate is | It would be |
|---|---|
| above 4.82 per cent | the eleventh month of rising inflation in a row, and the highest since December 2024 |
| above 5.22 per cent | the highest since November 2024 |
| above 5.48 per cent | the highest since October 2024 |
| 6.0 per cent or above | at the Reserve Bank's upper limit, which is also the Bank's own projection for October to December 2026, the quarter after September's |
| above 6.21 per cent | the highest since August 2023 |
| above 6.83 per cent | the highest since July 2023 |
| above 7.44 per cent | the highest since April 2022 |
When the release comes, read three figures: all items against 4.82 per cent, food against 5.95 per cent, and rural against 5.23 per cent.
Source: MoSPI press release, 14 September 2026, CPI for August 2026 ; RBI Monetary Policy Committee resolution, 7 October 2026 .
The essentials
The consumer price index measures what a household pays for a fixed basket of goods and services. The Ministry of Statistics publishes it once a month, and the rate of inflation is how much higher the index is than in the same month a year before.
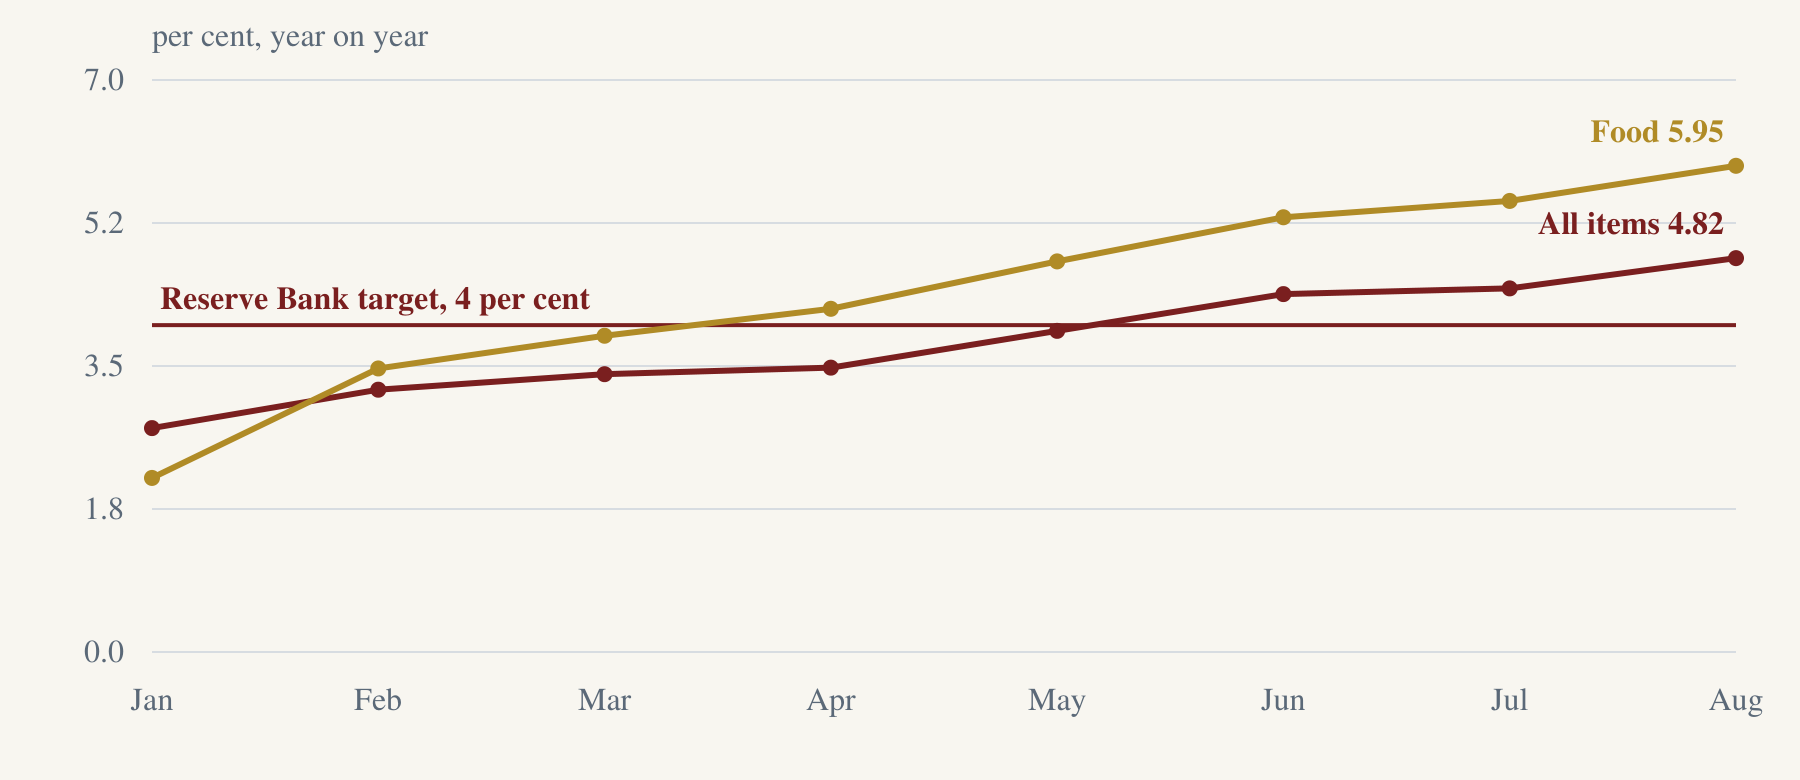
In the year to August 2026 prices rose 4.82 per cent, and the rate is the highest in 20 months. The rate started the year at 2.74 per cent, and it has risen in every month of 2026. The run began after October 2025: in each of the 10 months since then the rate has been higher than in the month before, and that is the longest run in the Ministry's series, whose rates begin in January 2012.
Source: MoSPI press release, 14 September 2026, CPI for August 2026 ; MoSPI eSankhyiki interface, CPI base 2024, read 11 October 2026 .
Food: the highest rate in 19 months
Food prices rose 5.95 per cent in the year to August 2026, which is the highest food rate in 19 months. That rate too rose in every month of 2026.
Source: MoSPI press release, 14 September 2026, CPI for August 2026 ; MoSPI eSankhyiki interface, CPI base 2024, read 11 October 2026 .
The village pays more
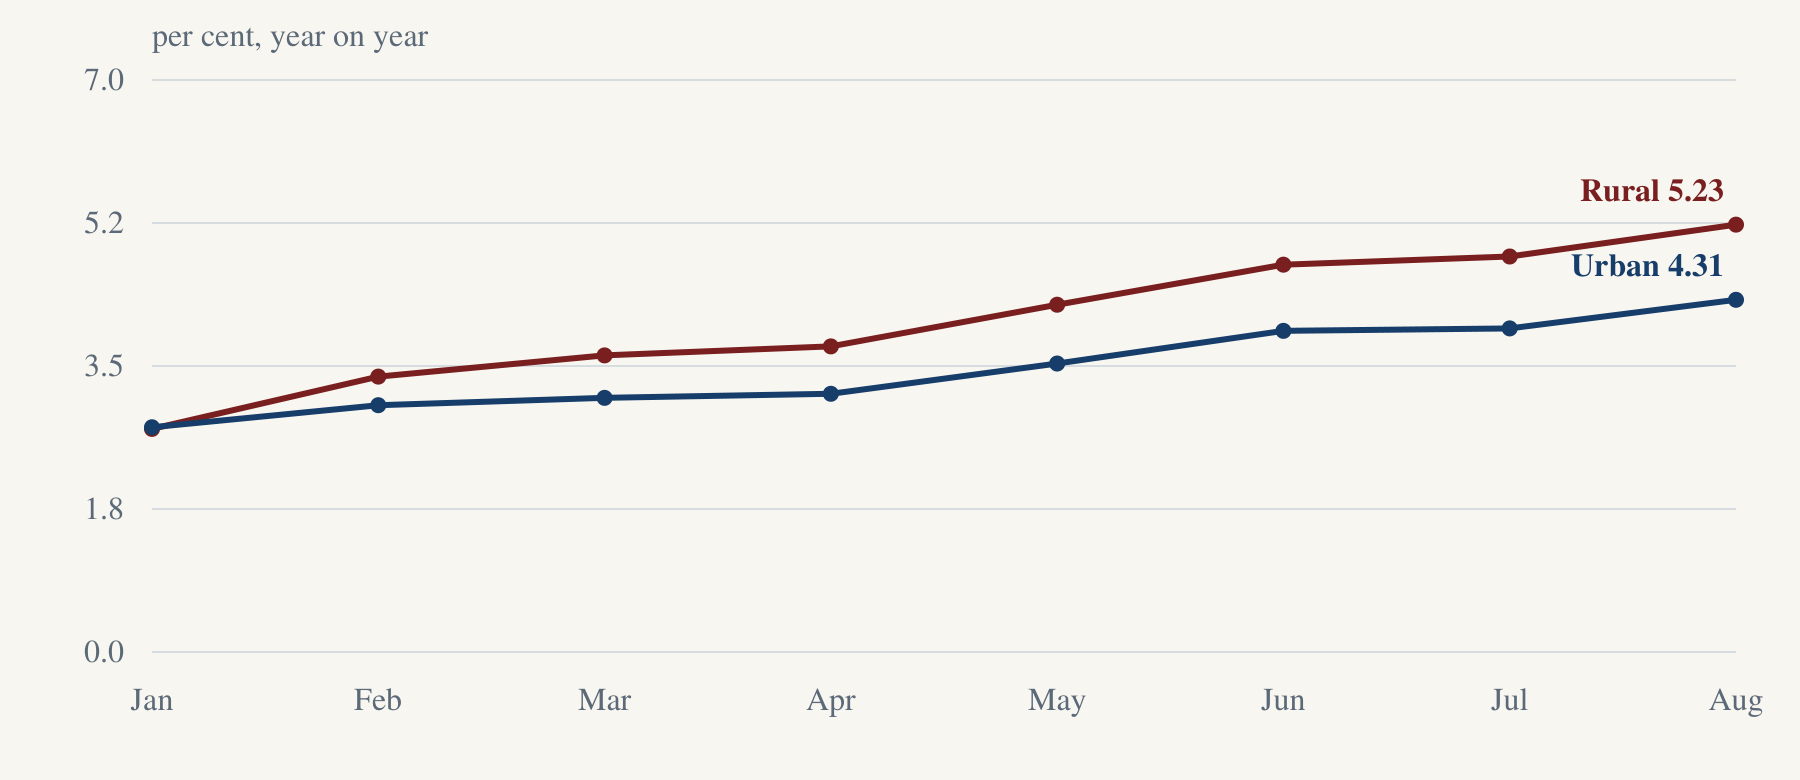
The rural rate was 5.23 per cent in August 2026, while the urban rate was 4.31 per cent, and the rural rate has been higher in every month since February 2026.
Source: MoSPI press release, 14 September 2026, CPI for August 2026 .
Farm labourers: food up 6.41 per cent
The agricultural labourer's index rose 5.18 per cent, and its food index rose 6.41 per cent, which is the highest of the five food rates published for August 2026.
Source: Labour Bureau press release, 18 September 2026, CPI-AL and CPI-RL for August 2026 .
The Reserve Bank expects 6.0 per cent
On 7 October 2026 the Reserve Bank raised the repo rate to 5.50 per cent, which makes borrowing dearer, and it said that rate cuts are off the table. It expects inflation of 6.0 per cent for October to December 2026, which is the top of its tolerance band, and almost 5.8 per cent on average over the next three quarters.
Source: RBI Monetary Policy Committee resolution, 7 October 2026 .
Eight months, eight rises
The all-items rate climbed from 2.74 per cent in January to 4.82 per cent in August 2026, and the food rate from 2.13 per cent to 5.95 per cent. The food rate crossed the Reserve Bank's 4 per cent target in April 2026 and the all-items rate crossed it in June 2026, and both have stayed above it since. The August 2026 rate is the highest in 20 months, and the food rate the highest in 19 months.
Source: MoSPI press release, 14 September 2026, CPI for August 2026 ; MoSPI eSankhyiki interface, CPI base 2024, read 11 October 2026 . Each observation's dated source is linked in its CSV row.
View the figures in a table
| Observation | Value | Official source |
|---|---|---|
| January 2026 | 2.74 | 2026-10-11 |
| February 2026 | 3.21 | 2026-10-11 |
| March 2026 | 3.4 | 2026-10-11 |
| April 2026 | 3.48 | 2026-10-11 |
| May 2026 | 3.93 | 2026-10-11 |
| June 2026 | 4.38 | 2026-10-11 |
| July 2026 | 4.45 | 2026-10-11 |
| August 2026 | 4.82 | 2026-10-11 |
The village and the town
The rural rate has been above the urban rate in every month since February 2026, and in August 2026 it was 5.23 per cent against 4.31 per cent, which is a gap of 0.92 percentage points. Rural food prices rose 6.13 per cent, while urban food prices rose 5.64 per cent.
Source: MoSPI press release, 14 September 2026, CPI for August 2026 ; MoSPI eSankhyiki interface, CPI base 2024, read 11 October 2026 . Each observation's dated source is linked in its CSV row.
View the figures in a table
| Observation | Value | Official source |
|---|---|---|
| January 2026 | 2.73 | 2026-10-11 |
| February 2026 | 3.37 | 2026-10-11 |
| March 2026 | 3.63 | 2026-10-11 |
| April 2026 | 3.74 | 2026-10-11 |
| May 2026 | 4.25 | 2026-10-11 |
| June 2026 | 4.74 | 2026-10-11 |
| July 2026 | 4.84 | 2026-10-11 |
| August 2026 | 5.23 | 2026-10-11 |
The divisions above the target
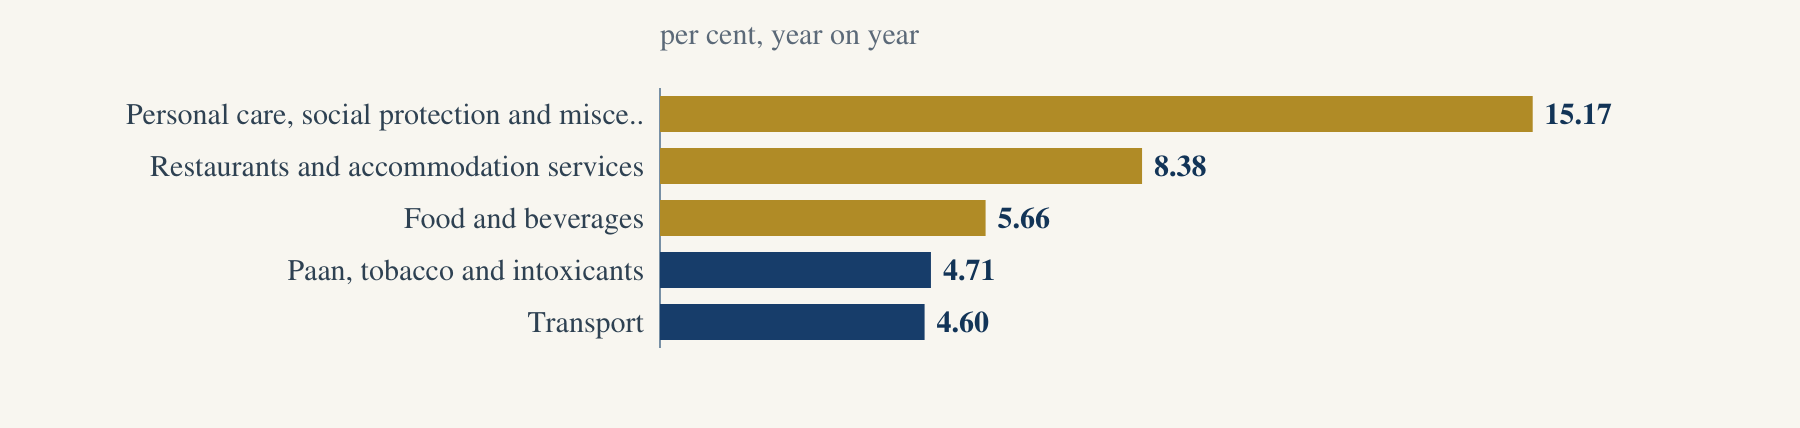
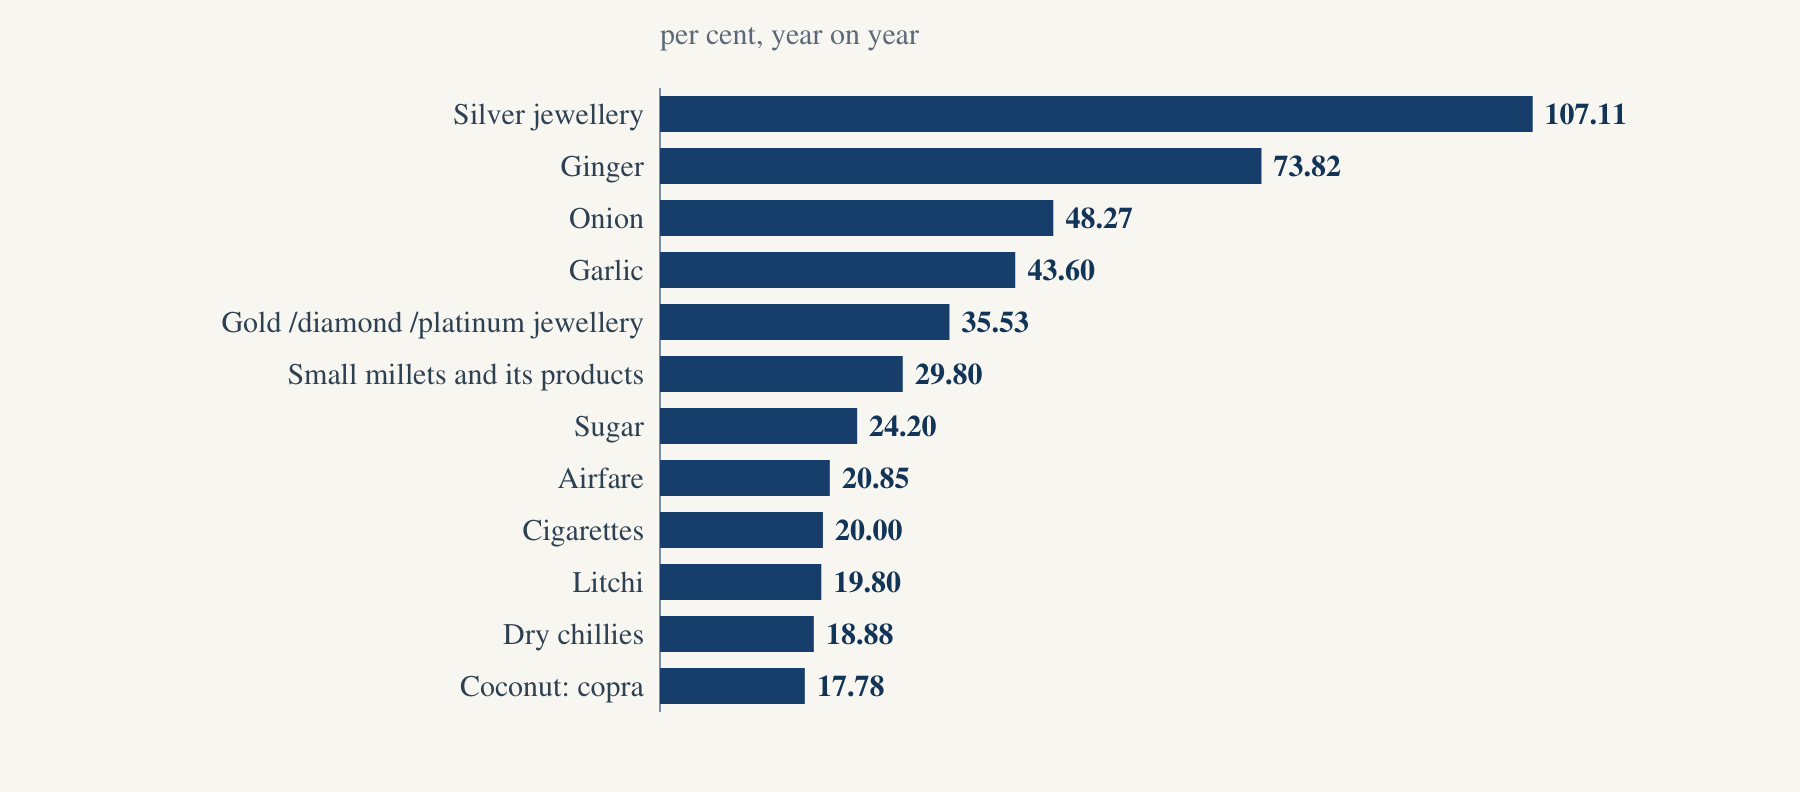
Five divisions of the basket rose faster than the Reserve Bank's 4 per cent target, and three of them rose faster than the headline rate of 4.82 per cent. Personal care, social protection and miscellaneous goods and services rose 15.17 per cent. Inside that division, the Ministry's group of other personal effects, which holds jewellery, rose 44.56 per cent. The Ministry's release lists silver jewellery at 107.11 per cent and gold, diamond and platinum jewellery at 35.53 per cent among its five items with the highest rates. Restaurants and accommodation services rose 8.38 per cent and food and beverages 5.66 per cent. Paan, tobacco and intoxicants and transport also rose faster than the target.
Source: MoSPI eSankhyiki interface, CPI base 2024, read 11 October 2026 ; MoSPI press release, 14 September 2026, CPI for August 2026 . Each observation's dated source is linked in its CSV row.
View the figures in a table
| Observation | Value | Official source |
|---|---|---|
| Personal care, social protection and miscellaneous goods and services | 15.17 | 2026-10-11 |
| Restaurants and accommodation services | 8.38 | 2026-10-11 |
| Food and beverages | 5.66 | 2026-10-11 |
| Paan, tobacco and intoxicants | 4.71 | 2026-10-11 |
| Transport | 4.6 | 2026-10-11 |
The items that rose most
Of the 358 items the Ministry prices, 88 rose faster than the headline rate in the year to August 2026. Ginger rose 73.82 per cent, onion 48.27 per cent and garlic 43.60 per cent. The Reserve Bank's resolution of 7 October 2026 says: "Food price increases have become more broad based along with notable spikes in certain items such as sugar and onion".
Source: MoSPI eSankhyiki interface, CPI base 2024, read 11 October 2026 ; MoSPI press release, 14 September 2026, CPI for August 2026 . Each observation's dated source is linked in its CSV row.
View the figures in a table
| Observation | Value | Official source |
|---|---|---|
| Silver jewellery | 107.11 | 2026-10-11 |
| Ginger | 73.82 | 2026-10-11 |
| Onion | 48.27 | 2026-10-11 |
| Garlic | 43.6 | 2026-10-11 |
| Gold /diamond /platinum jewellery | 35.53 | 2026-10-11 |
| Small millets and its products | 29.8 | 2026-10-11 |
| Sugar | 24.2 | 2026-10-11 |
| Airfare | 20.85 | 2026-10-11 |
| Cigarettes | 20.0 | 2026-10-11 |
| Litchi | 19.8 | 2026-10-11 |
| Dry chillies | 18.88 | 2026-10-11 |
| Coconut: copra | 17.78 | 2026-10-11 |
| Item | Weight | July 2026 | August 2026 |
|---|---|---|---|
| Silver Jewellery | 0.3127 | 109.89 | 107.11 |
| Ginger | 0.2556 | 83.57 | 73.82 |
| Onion | 0.7006 | 22.54 | 48.27 |
| Garlic | 0.3738 | 35.36 | 43.60 |
| Gold/Diamond/Platinum Jewellery | 0.6230 | 32.98 | 35.53 |
Source: MoSPI press release, 14 September 2026, CPI for August 2026 .
Six measures, one month
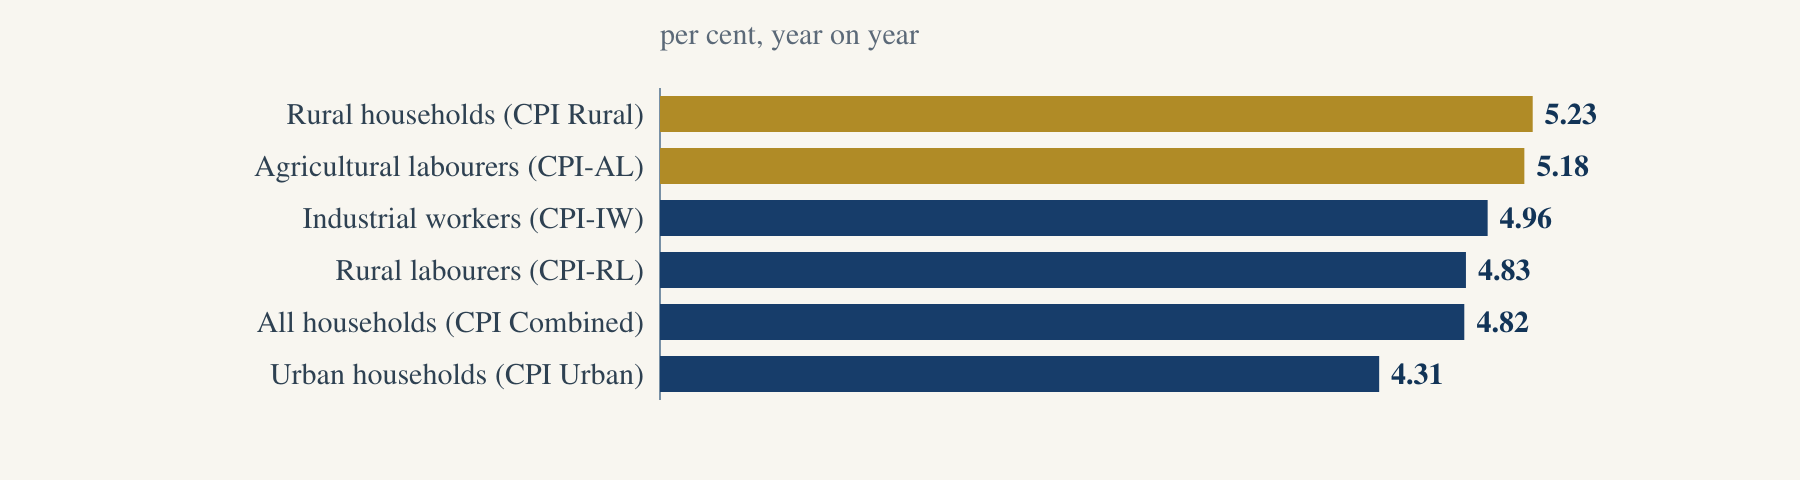
The Government publishes six consumer price indices for the same month: the Ministry's rural, urban and all-India combined indices, and the Labour Bureau's three for industrial workers, agricultural labourers and rural labourers. In August 2026 the rural household's rate was the highest, at 5.23 per cent, and even the urban household's rate, at 4.31 per cent, was above the Reserve Bank's 4 per cent target. The agricultural labourer's rate was 5.18 per cent, and the industrial worker's was 4.96 per cent, while the rural labourer's was 4.83 per cent.
Source: MoSPI press release, 14 September 2026, CPI for August 2026 ; Labour Bureau press release, 30 September 2026, CPI-IW for August 2026 ; Labour Bureau press release, 18 September 2026, CPI-AL and CPI-RL for August 2026 . Each observation's dated source is linked in its CSV row.
View the figures in a table
| Observation | Value | Official source |
|---|---|---|
| Rural households (CPI Rural) | 5.23 | 2026-09-14 |
| Agricultural labourers (CPI-AL) | 5.18 | 2026-09-18 |
| Industrial workers (CPI-IW) | 4.96 | 2026-09-30 |
| Rural labourers (CPI-RL) | 4.83 | 2026-09-18 |
| All households (CPI Combined) | 4.82 | 2026-09-14 |
| Urban households (CPI Urban) | 4.31 | 2026-09-14 |
On food the agricultural labourer's index rose 6.41 per cent, which was the highest of the five rates published, and the rural household's rose 6.13 per cent, while the urban household's rose 5.64 per cent.
| Index | Food rate |
|---|---|
| Agricultural labourers, food (CPI-AL) | 6.41 |
| Rural households, food (CPI Rural) | 6.13 |
| Rural labourers, food (CPI-RL) | 5.97 |
| All households, food (CPI Combined) | 5.95 |
| Urban households, food (CPI Urban) | 5.64 |
Source: MoSPI press release, 14 September 2026, CPI for August 2026 ; Labour Bureau press release, 18 September 2026, CPI-AL and CPI-RL for August 2026 .
What the September figure would be the highest since
August's 4.82 per cent is already the highest rate in 20 months. Any September figure above it makes eleven months of rising inflation in a row, and the highest rate since December 2024. A figure above 5.22 per cent would be the highest since November 2024, and one above 5.48 per cent the highest since October 2024. At 6.0 per cent the rate reaches the Reserve Bank's upper limit, and 6.0 per cent is what the Bank itself projects for the quarter after September's, which is October to December 2026.
Source: MoSPI eSankhyiki interface, CPI base 2024, read 11 October 2026 ; MoSPI eSankhyiki interface, CPI base 2012, read 11 October 2026 ; MoSPI eSankhyiki interface, back series 2013 to 2024, read 11 October 2026 ; RBI Monetary Policy Committee resolution, 7 October 2026 . Each observation's dated source is linked in its CSV row.
View the figures in a table
| Observation | Value | Official source |
|---|---|---|
| August 2026, the latest | 4.82 | 2026-10-11 |
| December 2024 | 5.22 | 2026-10-11 |
| November 2024 | 5.48 | 2026-10-11 |
| October 2024 | 6.21 | 2026-10-11 |
| August 2023 | 6.83 | 2026-10-11 |
| July 2023 | 7.44 | 2026-10-11 |
| April 2022 | 7.79 | 2026-10-11 |
A food bill, a year on
Food that cost Rs 10,000 in August 2025 cost Rs 10,595 in August 2026, because the Ministry's combined food rate is 5.95 per cent. A village household, whose food prices rose 6.13 per cent, paid Rs 10,613 for the same food, and a farm labourer's household, whose food index rose 6.41 per cent, paid Rs 10,641. Each figure is the same bill multiplied by one published rate.
Try your own monthly spending on food at home.
Enter an amount between Rs 0 and Rs 100,000,000.
Food bill a year ago x (1 + the food rate) = the same food now
The three figures use the published food rates and nothing else. What a particular family pays depends on what it buys and where it buys it, so its own bill can differ from these figures.
Ten months of rising inflation, and every figure is the Government's own.
Terms, explained
- Consumer price index
- The consumer price index measures what a household pays for a fixed basket of goods and services. The Ministry of Statistics publishes it once a month, and the rate of inflation is how much higher the index is than in the same month a year before.
- Rate of inflation
- The percentage by which the index is higher than it was in the same month a year before. A rate of 4.82 per cent means that prices are 4.82 per cent higher than they were a year ago.
- Consumer Food Price Index
- The food part of the index. On the 2024 base it is the Food group, which carries the items a household eats at home.
- Base year
- The year whose prices are set at 100. The Ministry moved to the 2024 base in February 2026 and publishes a back series on it from 2013.
- CPI-IW, CPI-AL and CPI-RL
- The Labour Bureau's indices for industrial workers, agricultural labourers and rural labourers, each pricing the basket of that kind of household.
- Tolerance band
- The Reserve Bank's target is 4 per cent, and it may let the rate move between 2 and 6 per cent.
- Repo rate
- The rate at which the Reserve Bank lends to banks. Raising it makes borrowing dearer across the economy.
- Provisional
- The Ministry marks the latest month's figure provisional and finalises it a month later.
Downloads for readers and the press
Sources & method
The Ministry of Statistics publishes the consumer price index on the 2024 base each month, in its press release and through its eSankhyiki interface, which this brief read on 11 October 2026, when the August figures were the latest. This office checked the rates for February to August 2026 against the Ministry's press release of each month, and every one agreed; January's 2.74 per cent is the figure the Ministry printed in its Lok Sabha answer of 29 July 2026. To get the rate of inflation, divide the index by the index of twelve months earlier and subtract one. The run of rises counts the consecutive months in which the Ministry's published rate was higher than in the month before, and it uses each month's rate on the base that the Ministry published it on. The Labour Bureau's indices come from the press releases that it issued on 18 and 30 September 2026, and the older months come from the Reserve Bank's Database on Indian Economy, which copies the Bureau.
The Ministry says that a direct comparison of its 2024 series with its 2012 series is not feasible, and it publishes a back series on the 2024 base from January 2013 to December 2024, whose monthly rates are the same as the 2012 series it printed at the time. Where this brief says a rate is the highest in so many months, or counts a run of rises, it reads each month's headline rate on the base the Ministry published it on, which is the 2024 base from January 2026 and the 2012 base before that. The months of 2022 to 2024 that the ladder names carry the same rates on the Ministry's back series. This office also recomputed the rates of 2025 on the Ministry's two 2024-base index series alone, dividing each month's current-series index by the back-series index of the same month a year earlier, and on that reading too the run is 10 months from October 2025 and August 2026 is the highest since December 2024. The food rate before 2026 is the Ministry's Consumer Food Price Index on the 2012 base, for which no back series exists, and the comparison with January 2025 rests on a margin of 0.02 points.
- MoSPI press release, 14 September 2026, CPI for August 2026 .
- MoSPI eSankhyiki interface, CPI base 2024, read 11 October 2026 .
- MoSPI eSankhyiki interface, back series 2013 to 2024, read 11 October 2026 .
- MoSPI eSankhyiki interface, CPI base 2012, read 11 October 2026 .
- MoSPI eSankhyiki interface, CPI base 2010, read 11 October 2026 .
- RBI DBIE, CPI Rural, Urban and Combined, read 11 October 2026 .
- RBI DBIE, other consumer price indices, read 11 October 2026 .
- Labour Bureau press release, 30 September 2026, CPI-IW for August 2026 .
- Labour Bureau press release, 18 September 2026, CPI-AL and CPI-RL for August 2026 .
- Labour Bureau, CPI-IW release calendar for 2026 .
- RBI Monetary Policy Committee resolution, 7 October 2026 .
- RBI Handbook of Statistics 2025-26, Table 34 and its notes .
- MoSPI Lok Sabha answer, 29 July 2026, on the revised CPI base .