Fertiliser output
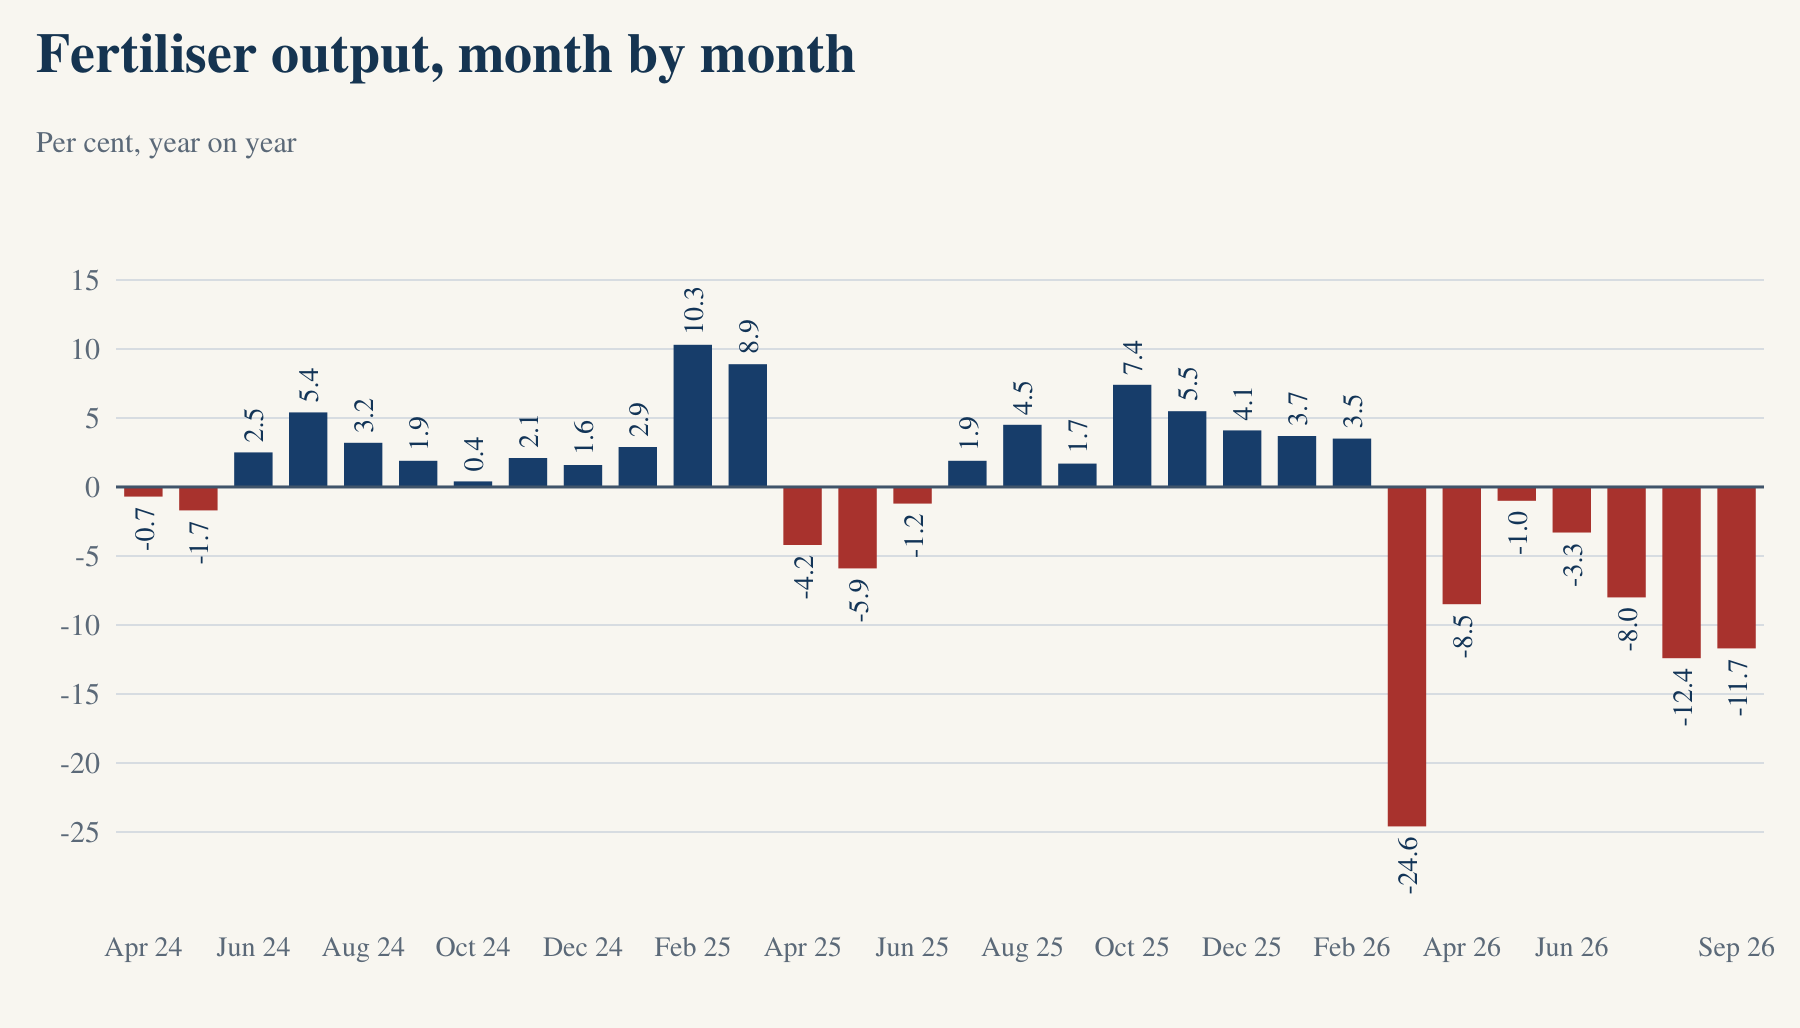
Fertiliser output fell in each month from March 2026 to September 2026, when each is set against the same month a year earlier. The falls were 24.6, 8.5, 1.0, 3.3, 8.0, 12.4 and 11.7 per cent, in that order.
No run this long appears on either of the Office's two series since April 2012. The older 2011-12 series, which gives growth rates from April 2012 to May 2026, never ran longer than five months, from January to May 2024, and the 2022-23 series, which gives them from April 2024, never ran longer than three months before this run. The fertiliser index for September 2026 was 96.7, the lowest of the four Septembers on the 2022-23 series, which begins in April 2023.
Source: OEA release for September 2026, 21 October 2026 ; OEA workbook, 2022-23 series, 21 October 2026 ; OEA workbook, 2011-12 series, 20 July 2026 .
The essentials
Fertiliser output has been below its level of a year earlier for seven months in a row, a run that lasts from March 2026 to September 2026. In September 2026 it was 11.7 per cent below September 2025, and that figure is provisional. The Office of the Economic Adviser (OEA) publishes the Index of Core Industries, and both figures come from it. No run this long appears on either of the Office's two series since April 2012. The older 2011-12 series, which gives growth rates from April 2012 to May 2026, never ran longer than five months, from January to May 2024, and the 2022-23 series, which gives them from April 2024, never ran longer than three months before this run. The fertiliser index for September 2026 was 96.7, the lowest of the four Septembers on the 2022-23 series, which begins in April 2023.
Source: OEA release for September 2026, 21 October 2026 ; OEA workbook, 2022-23 series, 21 October 2026 ; OEA workbook, 2011-12 series, 20 July 2026 .
Fertilisers, September 2026
Fertiliser output has been below its level of a year earlier for seven months in a row, a run that lasts from March 2026 to September 2026. In September 2026 it was 11.7 per cent below September 2025, and that figure is provisional. The Office of the Economic Adviser (OEA) publishes the Index of Core Industries, and both figures come from it. No run this long appears on either of the Office's two series since April 2012.
Source: OEA release for September 2026, 21 October 2026 ; OEA workbook, 2022-23 series, 21 October 2026 ; OEA workbook, 2011-12 series, 20 July 2026 .
The lowest September
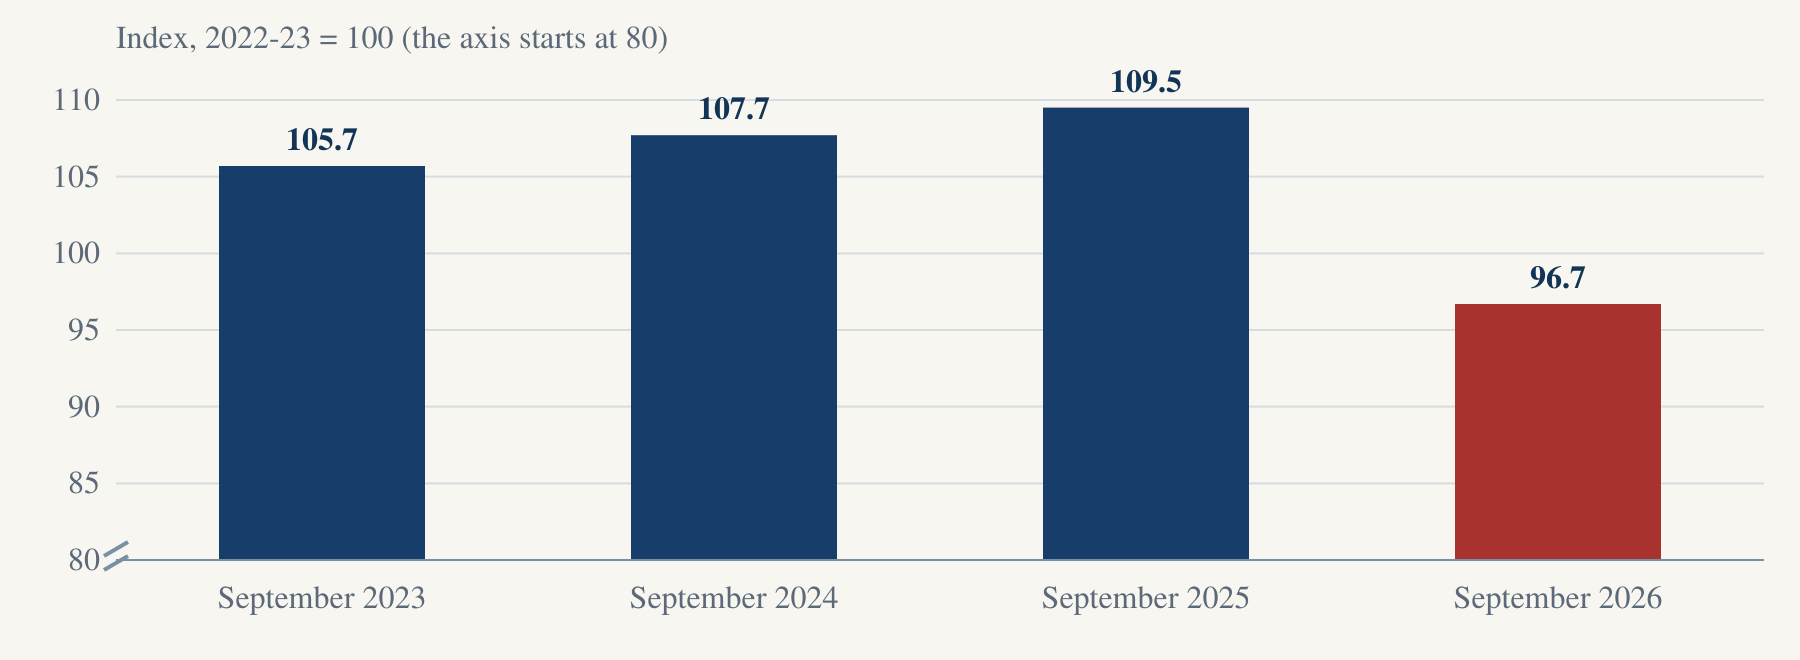
The fertiliser index stood at 96.7 in September 2026. It was 109.5 in September 2025, 107.7 in September 2024 and 105.7 in September 2023.
Source: OEA release for September 2026, 21 October 2026 ; OEA workbook, 2022-23 series, 21 October 2026 .
April to September 2026
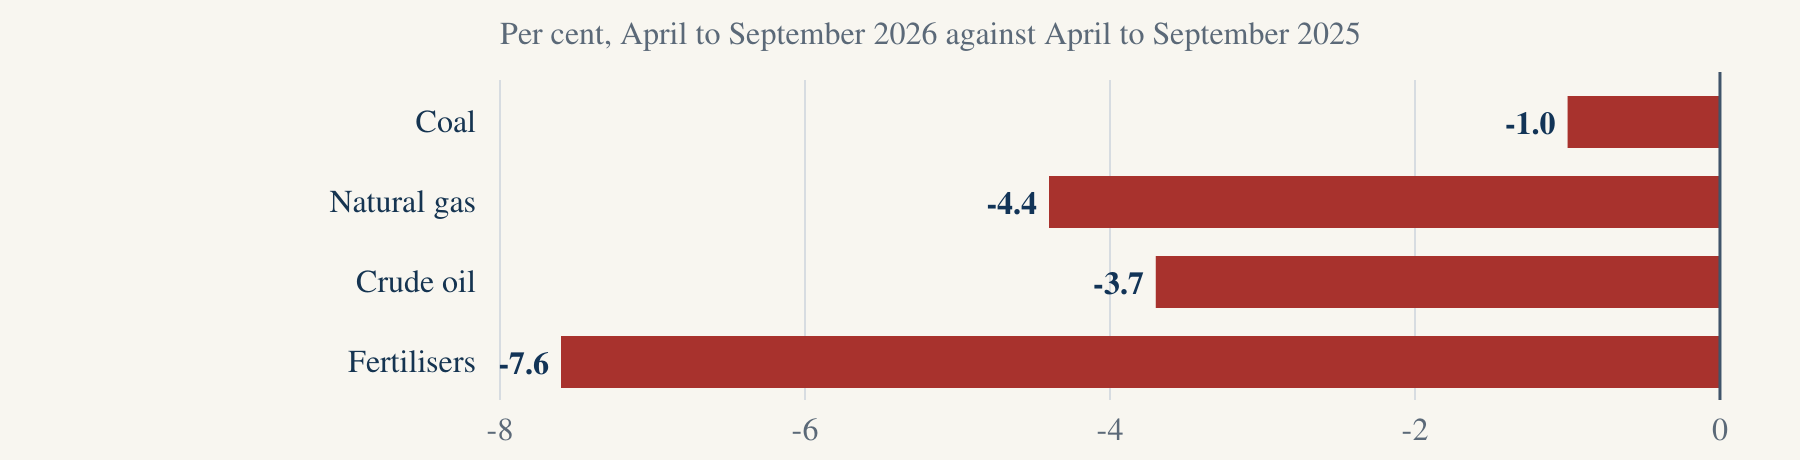
When the Office compares April to September 2026 with the same months a year earlier, four of the nine core industries produced less. They were coal, natural gas, crude oil and fertilisers.
Source: OEA release for September 2026, 21 October 2026 ; OEA workbook, 2022-23 series, 21 October 2026 .
Natural gas and crude oil
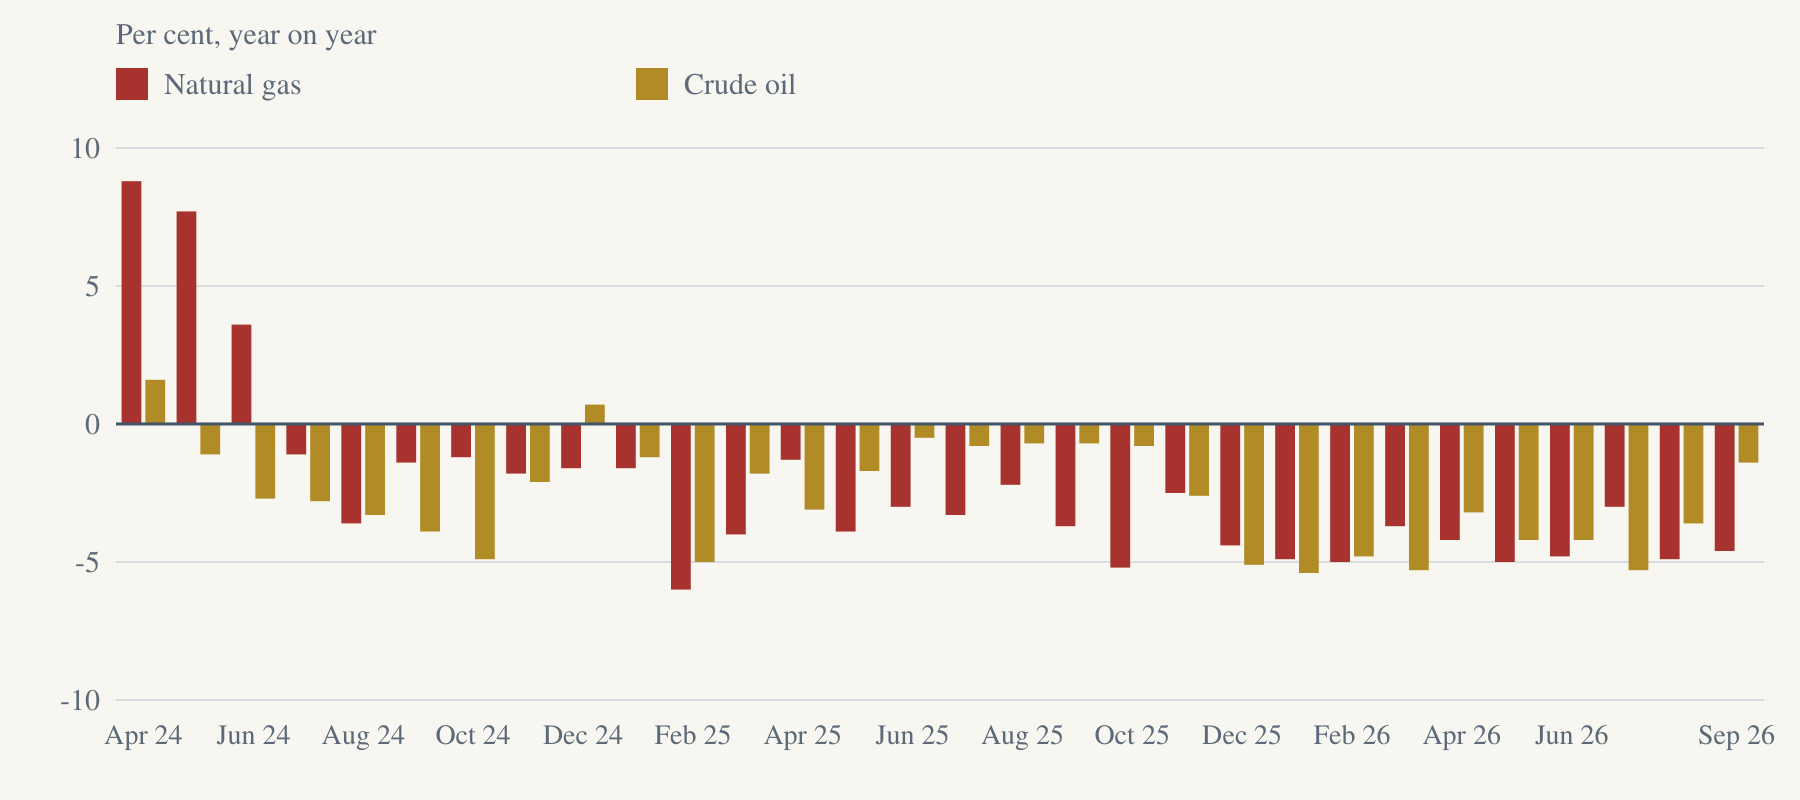
Natural gas output has been below the same month of the year before in every month from July 2024 to September 2026, which makes 27 months in a row. Crude oil output has been below it in every month from January 2025 to September 2026, which makes 21 months in a row.
Source: OEA release for September 2026, 21 October 2026 ; OEA workbook, 2022-23 series, 21 October 2026 .
The monsoon
The Reserve Bank's Monetary Policy Committee wrote on 7 October 2026: "Deficient south-west monsoon and strong El Niño conditions pose risks to agriculture sector's outlook and rural demand ..."
Source: RBI MPC resolution, 7 October 2026 .
Fertiliser output, month by month
Fertiliser output fell in each month from March 2026 to September 2026, when each is set against the same month a year earlier. The falls were 24.6, 8.5, 1.0, 3.3, 8.0, 12.4 and 11.7 per cent, in that order.
Source: OEA release for September 2026, 21 October 2026 ; OEA workbook, 2022-23 series, 21 October 2026 . Each observation's dated source is linked in its CSV row.
View the figures in a table
The fertiliser index in September of each year
The fertiliser index stood at 96.7 in September 2026. It was 109.5 in September 2025, 107.7 in September 2024 and 105.7 in September 2023.
Source: OEA workbook, 2022-23 series, 21 October 2026 . Each observation's dated source is linked in its CSV row.
View the figures in a table
| Observation | Value | Official source |
|---|---|---|
| September 2023 | 105.7 | OEA release for September 2026, 21 October 2026 |
| September 2024 | 107.7 | OEA release for September 2026, 21 October 2026 |
| September 2025 | 109.5 | OEA release for September 2026, 21 October 2026 |
| September 2026 | 96.7 | OEA release for September 2026, 21 October 2026 |
The average fertiliser index for April to September was 97.9 in 2026, against 106.0 in 2025, 106.4 in 2024 and 104.6 in 2023. This year's figure is the lowest of the four years that the series covers.
Industries that produced less than a year earlier
When the Office compares April to September 2026 with the same months a year earlier, four of the nine core industries produced less. They were coal, natural gas, crude oil and fertilisers.
Source: OEA release for September 2026, 21 October 2026 . Each observation's dated source is linked in its CSV row.
View the figures in a table
| Observation | Value | Official source |
|---|---|---|
| Coal | -1.0 | OEA release for September 2026, 21 October 2026 |
| Natural gas | -4.4 | OEA release for September 2026, 21 October 2026 |
| Crude oil | -3.7 | OEA release for September 2026, 21 October 2026 |
| Fertilisers | -7.6 | OEA release for September 2026, 21 October 2026 |
Natural gas and crude oil
Natural gas output has been below the same month of the year before in every month from July 2024 to September 2026, which makes 27 months in a row. Crude oil output has been below it in every month from January 2025 to September 2026, which makes 21 months in a row.
Source: OEA workbook, 2022-23 series, 21 October 2026 . Each observation's dated source is linked in its CSV row.
View the figures in a table
The natural gas and crude oil indices for September 2026 were the lowest for any September since the series began in April 2023.
The monsoon, in the Government's own words
The Reserve Bank's Monetary Policy Committee wrote on 7 October 2026: "Deficient south-west monsoon and strong El Niño conditions pose risks to agriculture sector's outlook and rural demand ..." The Agriculture Ministry reported on 21 July 2026: "During the period from June 1 to July 15, 2026, the average rainfall in the country was recorded at 23 per cent below normal."
Each figure shows how far fertiliser output fell below the level that it reached in the same month a year earlier.
The Office's own figures show that domestic fertiliser output was below its level of a year earlier in each month from March 2026 to September 2026, and in June, July, August and September 2026 it was 3.3, 8.0, 12.4 and 11.7 per cent below.
The Office's own figures show that fertiliser output was below its level of a year earlier in every month from March 2026 to September 2026, and in September 2026 it was 11.7 per cent below, on the provisional figure.
Terms, explained
- Index of Core Industries
- The Office of the Economic Adviser in the Department for Promotion of Industry and Internal Trade measures the output of nine core industries each month and publishes an index for each. The year 2022-23 is set to 100.
- Growth rate
- The Office compares a month's index with the same month a year earlier, and a negative rate means that output fell.
- April to a month
- The Office averages the months from April, which starts the financial year, and compares that average with the same months a year earlier.
- Provisional
- The latest month is provisional, and the Office prints its final figure a month later.
- Weight
- Each industry's share of the whole index, which the Office takes from the index of industrial production, and the nine weights add up to 100.
Downloads for readers and the press
Sources & method
Every figure on output in this brief comes from the Index of Core Industries, which the Office of the Economic Adviser (OEA) publishes. The Office measures the output of nine core industries each month, and it publishes an index for each, where the year 2022-23 is set to 100.
A growth rate here is the Office's own, which compares a month's index with the same month a year earlier. Where a figure covers April to a month, it compares the average of those months with the same months a year earlier.
The Office moved the index to the base year 2022-23 on 20 July 2026, and its growth rates begin in April 2024. Its older series, on the base 2011-12, ran to May 2026, and this brief reads it on its own and never joins the two.
This brief works out three kinds of figure from the Office's own: the April to September averages of 2023 and 2024, the runs of months in which output was below its level of a year earlier, and the ranking of a month against the other months of its series. It prints every other figure as the Office prints it, to one decimal. The latest month is provisional, and the Office prints its final figure a month later.
- OEA release for September 2026, 21 October 2026 .
- OEA workbook, 2022-23 series, 21 October 2026 .
- OEA workbook, 2011-12 series, 20 July 2026 .
- RBI MPC resolution, 7 October 2026 .
- Agriculture Ministry release, 21 July 2026 .